Federal Spending Odds & Ends, Why DOGE is necessary
9 videos
Updated 5 months ago
In short, these videos will chronicle the federal spending tsunami & why we need to put an end to it. #DOGE
They might focus on overall federal spending or just a specific facet of it. We need to start chiseling away at this national debt posthaste or your grandchildren might live in a county that resembles a dystopian hell-scape.
The Soviet Union collapsed because of government mismanagement & a fiat currency that was worthless. It could happen here, we have run out of other peoples' money
-
Federal Spending Odds & Ends: Interest Payments/Transfer Payments to Individuals
UTubekookdetectorFederal Spending Odds & Ends: Washington is a giant ATM machine #DOGE Federal Spending data https://web.archive.org/web/20240705083452/https://www.whitehouse.gov/omb/budget/historical-tables/ https://web.archive.org/web/20241130122049/https://www.whitehouse.gov/wp-content/uploads/2024/03/hist_fy2025.zip https://web.archive.org/web/20241208132545/https://www.whitehouse.gov/wp-content/uploads/2024/03/hist08z2_fy2025.xlsx https://web.archive.org/web/20241222225328/https://www.whitehouse.gov/wp-content/uploads/2024/03/hist11z1_fy2025.xlsx *** U.S. Population Data https://www.census.gov/data/datasets/time-series/demo/popest/2020s-counties-total.html https://www.census.gov/data/datasets/time-series/demo/popest/2010s-counties-total.html https://www2.census.gov/library/publications/2011/compendia/statab/131ed/2012-statab.pdf U.S. Population 2000 = 282,172,000 * 2001 = 285,082,000 * 2002 = 287,804,000 * 2003 = 290,326,000 * 2004 = 293,046,000 * 2005 = 295,753,000 * 2006 = 298,593,000 * 2007 = 301,580,000 * 2008 = 304,375,000 * 2009 = 307,007,000 * 2010 = 308,745,538 * 2011 = 311,556,874 * 2012 = 313,830,990 * 2013 = 315,993,715 * 2014 = 318,301,008 * 2015 = 320,635,163 * 2016 = 322,941,311 * 2017 = 324,985,539 * 2018 = 326,687,501 * 2019 = 328,239,523 * 2020 = 331,464,948 * 2021 = 332,048,977 * 2022 = 333,271,411 * 2023 = 334,914,895 * Grand Total = 7,473,134,960 *** In this edition I’m going to cover payments to individuals by our federal government & interest payments on our debt (net interest). Head over to Table 11.1 kids & we’re going to first tally “Payments for individuals & “As Percentages of Total Outlays.” FY (Fiscal Year) 1970-2023 average = 56.59% of ALL federal outlays * FY 2000-2023 average = 66.095% of ALL federal outlays. Our federal government has become a giant ATM machine. Now let’s look at some other time frames & this will demonstrate to you the jam we are in. I should also mention, one of the reasons the Democrats want to nationalize so many programs (and get GOP help, all too often) is to crash the economy (Ron Paul said as much on the House floor in circa 2011 – said this POTUS & Congress are trying to crash the economy), give states less autonomy & the states cannot create a fiat currency. If California were responsible for its unemployment programs, it would be more difficult during a COVID-style plandemic to pay much of the state to sit on its ass & do nothing. When Leviathan is in control, California can lock down & get Iowa (which did not lock down & has a higher % of people participating in the labor force) to pay for it. The same goes for food stamps/SNAP, Medicaid, etc. I digress. “Payments for individuals,” “As Percentages of Total Outlays” FY 1954-1961 (Eisenhower) average = 23.325% * FY 1962-1969 (JFK/LBJ) = 28.437% * FY 1978-1981 (Carter) = 47.275% * FY 1982-89 (Ronald Reagan) = 48.012% * FY 1994-2001 (Bill Clinton) = 59.437% * FY 2002-09 (George W. Bush) = 61.762% * FY 2010-17 (Barry Obongo) = 69.437% * FY 2018-2023 (Trump & Biden) = 69.283% Do you see how this is not sustainable? Do you want an economic collapse? A fiat currency is Collectivist wet dream & that’s part of the reason this spending continues unabated. Karl Marx would LOVE the Federal Reserve https://mises.org/mises-wire/why-marx-loved-central-banks “Chronic monetary inflation, for instance, discourages savings; running into ever greater amounts of debt gets cultivated; by central banks’ downward manipulation of the interest rate, the future needs get debased compared to present needs; the favoring of a sort of monetary “Deep State” comes at the expense of demolishing civil and entrepreneurial liberties.” “Today’s world depends on the fiat US dollar issued by the Fed more than ever. Effectively all other major currencies are built upon the Greenback, and it is the Fed that determines the credit and liquidity conditions in international financial markets. It effectively presides over a world central bank cartel which, if it is allowed to continue unimpededly, will eventually steer and control the world economy through its unassailable money production monopoly, effectively removing one of the most critical roadblocks against unrestricted state tyranny.” We need #DOGE more than ever! Once you see how much the federal budget en masse has grown https://rumble.com/v6qiakw-lyin-brian-tyler-cohen-is-really-worried-about-medicaid-spending.html this is even more disheartening. Now let’s run that spending (“Payments for individuals,” Table 11.1) adjusted for inflation & per capita. FY 2000-2023 (7,473,134,960 population & $61,100,000,000,000 spent) = $8,175.95 per capita FY 2002-09 ($15,361,500,000,000 & 2,378,484,000 population) = $6,458.52 per capita FY 2010-17 ($21,058,600,000,000 & 2,536,990,138 population) = $8,300.62 per capita FY 2018-2023 (1,986,627,255 population & $21,716,300,000,000 spent) = $10,931.24 per capita This is NOT sustainable, my friends. Transfer Payments to Individuals on a per capita basis & adjusted for inflation were >69% HIGHER FY 2018-23 than they were when George W. Bush was President. Dwell on that for a few minutes before you call (or write) your elected officials & politely raise hell over this profligate spending. We’re talking about the younger Bush president, not a guy who has been in the ground for decades & lived to a ripe old age. What Leviathan has done to the middle class is criminal. #DOGE Now go to Table 8.3 & we’re going to examine “Net Interest” outlays as a % of all federal outlays. Don’t forget how much federal spending has grown since the 1970s. This is a ticking time bomb. “Net Interest” outlays as a percentage of all federal outlays, FY 1970-2023 = 9.663% * “Net Interest” outlays as a percentage of all federal outlays, FY 2000-2023 = 7.487%. Now for some other time frames to give you a better idea. “Net Interest” outlays as a percentage of all federal outlays, FY 1982-89 = 13.225% * “Net Interest” outlays as a percentage of all federal outlays, FY 1994-2001 = 13.937% * Net Interest” outlays as a percentage of all federal outlays, FY 2002-09 = 7.625% * Net Interest” outlays as a percentage of all federal outlays, FY 2010-17 = 6.25% * “Net Interest” outlays as a percentage of all federal outlays, FY 2018-23 = 7.516% Bill Clinton was actually a pretty decent POTUS (especially after he got slapped down by the voters in 1994) & his spending increases minus “net interest” payments look really good. George W. Bush did a poor job on spending. Clinton got hit w/ higher interest rates & George lucked out. Now let’s run those numbers on an inflation-adjusted basis & average it for various time frames (Table 8.2). “Net Interest” outlays adjusted for inflation, FY 1970-2023 yearly average = $238.5 BILLION * “Net Interest” outlays adjusted for inflation, FY 2000-23 yearly average = $277.891 Billion. Now for some other time frames. “Net Interest” outlays adjusted for inflation, FY 2002-09 = $237.15 Billion per year * “Net Interest” outlays adjusted for inflation, FY 2010-17 = $239.037 Billion per year * “Net Interest” outlays adjusted for inflation, FY 2018-23 = $379.283 Billion per year. Does that make you cringe? Now let’s run those numbers on a per capita basis. “Net Interest” outlays adjusted for inflation per capita FY 2000-2023 = (7,473,134,960 population & $6,669,400,000,000) $892.45 “Net Interest” outlays adjusted for inflation per capita FY 2002-09 (2,378,484,000 population & $1,897,200,000,000) = $797.65 “Net Interest” outlays adjusted for inflation per capita FY 2010-17 ($1,912,300,000,000 & 2,536,990,138 population) = $753.76 “Net Interest” outlays adjusted for inflation per capita FY 2018-23 (1,986,627,255 population & $2,275,700,000,000) = $1,145.50. Does that demonstrate the yoke that this government is placing on your grandchildren? That bill will have to be paid, so we can engage in some spending cuts now (and real cuts, not cuts in growth) or we can continue down this primrose path & some of you will get to live through an economic catastrophe, comparable & maybe even worse than The Great Depression. “Net Interest” payments, adjusted for inflation per capita are 43.5% HIGHER FY 2018-23 when compared to FY 2002-09. Again, if you have not written your elected officials do so now. Tell them you support #DOGE & Congressional rescission packages so we can start paying down our national debt. Otherwise, there will be a reckoning & the Democrats have NO intention of cutting any spending. They want us to go off a cliff. That’s why they defend this frivolous NIH spending, a bloated HHS & all this ridiculous spending that has been going on for decades. They don’t want to cut any spending, get it? The GOP needs more Rand Paul & less Chuck Grassley & Mitch McConnell. I had to vote for Grassley because the other guy was even crazier. Hopefully this series of videos https://rumble.com/playlists/IIv11M6lVOE has helped out & helped you see the economic collapse we’re going to have if we don’t do something. It’s depressing, but the discussion needs to happen. I do this so you don’t have to – Mr. Chairman, I Yield Back!173 views 6 comments -
Lyin' Brian Tyler Cohen is really worried about Medicaid spending
UTubekookdetectorVanilla Midget Brian Tyler Cohen is really worried about Medicaid spending Sources: https://web.archive.org/web/20240705083452/https://www.whitehouse.gov/omb/budget/historical-tables/ https://web.archive.org/web/20250116091700/https://www.whitehouse.gov/wp-content/uploads/2024/03/hist08z2_fy2025.xlsx https://web.archive.org/web/20250116091702/https://www.whitehouse.gov/wp-content/uploads/2024/03/hist08z6_fy2025.xlsx https://web.archive.org/web/20250116091706/https://www.whitehouse.gov/wp-content/uploads/2024/03/hist08z3_fy2025.xlsx https://web.archive.org/web/20241130122049/https://www.whitehouse.gov/wp-content/uploads/2024/03/hist_fy2025.zip (new page location is https://www.govinfo.gov/app/collection/budget) *** U.S. Population Data https://www.census.gov/data/datasets/time-series/demo/popest/2020s-counties-total.html https://www.census.gov/data/datasets/time-series/demo/popest/2010s-counties-total.html https://www2.census.gov/library/publications/2011/compendia/statab/131ed/2012-statab.pdf *** This mental midget is afraid Republicans are going to cut Medicaid, after they find out the vast amounts of fraud involved in the program. Medicaid should be left over to the states, this way when California uses ObamaCare https://www.youtube.com/watch?v=vJsCeGjI-vc (which was just a vehicle to expand the permanent underclass via Medicaid expansion & get us a step closer to single-payer health care, as well as outlawing any non-government insurance) to put much of their state on Medicaid & 49 other states get to pay for it. Democrats often classify America’s health care system as “capitalistic” or “for-profit”, when that is far from the truth, https://rumble.com/v69yiaj-brian-tyler-cohen-supporters-luigi-mangione-and-shamsud-din-jabbar.html their arguments are from ignorance. Much like a drug-addled lunatic has imaginary enemies chasing him, all the problems in America emanate from the tiny brain pan of the typical Pedocrat. They’re angry at American Health Care & instead of being mad at the government, they go out & murder CEOs that are simply operating under a set of rules given to them by politicians, most of which who have never had a decent job in the private sector. Let’s use Federal Government Spending Data & see how much (I’ve done this before, let’s do it again https://www.youtube.com/watch?v=r6x5naQwXRw & no Pedocrats could give me any details on the trajectory of Medicaid spending, they would probably think it’s been cut massively, but that would be a lie) Medicaid spending has exploded since it was foisted upon us. Using Table 8.3 at the old archived OMB site, here’s Medicaid as a % of all federal spending outlays (and look at how federal spending has rocketed-up over the past 60+ years, that would be Table 8.2) since 1970. [NOTE: Congress changed the beginning & end of the FY back in 1976, beginning on October 1 instead of July 1, which still stands today. A new POTUS takes office in January, but his first full FY will not begin until October 1. E.G. Barack Obama became POTUS on 1/20/09, but his first full FY (FY2010) did not begin until 10/1/09. NOTE: Pertaining to Total Federal Spending, they technically spend more than is totaled, because they subtract “Undistributed Offsetting Receipts” from the en masse total, but I’m going to leave it as it is. In addition, I will start the clock at the BEGINNING of the new POTUS’ first FULL FY. This will avoid the invariable “that’s my economy” crap we heard from Obama, trying to take credit for the Trump economy prior to COVID] Medicaid spending as a % of all federal outlays FY 1970-2023 = 5.325% Medicaid spending as a % of all federal outlays 1978-81 (Jimmy Carter) = 2.425% Medicaid spending as a % of all federal outlays 1982-89 (Ronald Reagan) = 2.562% Medicaid spending as a % of all federal outlays FY 1994-2001 (Bill Clinton) = 6.162% Medicaid spending as a % of all federal outlays 2002-09 (George W. Bush) = 7.187% Medicaid spending as a % of all federal outlays 2010-2017 (Barack Obama) = 8.425% **ObamaCare was the Medicaid Expansion Act & nothing more, these numbers illustrate that** Medicaid spending as a % of all federal outlays 2018-2021 (Donald J. Trump) = 8.325% Medicaid spending as a % of all federal outlays FY 2022-23 (“Kid Sniffer” Joe Biden) = 9.7% [NOTE: You could for example, see Medicaid spending as a % of all federal outlays declining, but that wouldn’t necessarily mean Medicaid spending is being cut, just that the federal budget outside of it is growing so much faster, keep that in mind] Now, using Table 8.2 at old school OMB, let us tally Medicaid spending adjusted for inflation (and from 2000 on, I will tally that per capita, just to make you see the explosion in spending) from 1970-2023 Medicaid spending adjusted for inflation (FY2017$) FY 1970-2023 per FY average = $169.629 (Billions) Medicaid spending adjusted for inflation (FY2017$) 1978-81 (Jimmy Carter) = $36.625 Medicaid spending adjusted for inflation (FY2017$) 1982-89 (Ronald Reagan) = $48.1 Medicaid spending adjusted for inflation (FY2017$) 1994-2001 (Bill Clinton) = $144.125 Medicaid spending adjusted for inflation (FY2017$) 2002-09 (George W. Bush) = $223.537 Medicaid spending adjusted for inflation (FY2017$) 2010-2017 (Barack Obama) = $319.662 Medicaid spending adjusted for inflation (FY2017$) 2018-2021 (Donald J. Trump) = $424.075 Medicaid spending adjusted for inflation (FY2017$) FY 2022-23 per FY average (“Kid Sniffer” Joe Biden) = $513.8 (Billions) Adjusting for inflation, Medicaid spending was >220% HIGHER under Barry Obama than it was under Bill Clinton & it has rocketed up ever further since then, just to give you some context when these mentally ill goofballs screech about “Medicaid being cut.” Medicaid’s growth could be limited to whatever inflation is (and there would be a fight over what yardstick we use to determine the inflation rate, as well as whether it should simply rise at the inflation rate, trust me) & Democrats would scream that it’s being cut. Medicaid is a runaway freight train, it needs to be reined-in & the best way to do that would be to block grant it to the states for one https://web.archive.org/web/20250120061010/http://c3244172.r72.cf0.rackcdn.com/wp-content/uploads/2011/10/RestoreAmericaPlan.pdf (like Ron Paul wanted to do) & eventually give it over to the states. This way, California cannot take advantage of states that have much higher labor force participation rates & aren’t looking to enlarge the permanent underclass. U.S. Population 2000 = 282,172,000 * 2001 = 285,082,000 * 2002 = 287,804,000 * 2003 = 290,326,000 * 2004 = 293,046,000 * 2005 = 295,753,000 * 2006 = 298,593,000 * 2007 = 301,580,000 * 2008 = 304,375,000 * 2009 = 307,007,000 * 2010 = 308,745,538 * 2011 = 311,556,874 * 2012 = 313,830,990 * 2013 = 315,993,715 * 2014 = 318,301,008 * 2015 = 320,635,163 * 2016 = 322,941,311 * 2017 = 324,985,539 * 2018 = 326,687,501 * 2019 = 328,239,523 * 2020 = 331,464,948 * 2021 = 332,048,977 * 2022 = 333,271,411 * 2023 = 334,914,895 * Grand Total = 7,473,134,960 Now, let’s run the numbers, Medicaid spending per capita & see how it has exploded using that metric: FY 2000-23 average (7,473,134,960 population & $7,402,300,000,000 in cumulative, inflation adjusted Medicaid spending during that time frame, or $308,429,166,666.666 per year) = $990.52 per person. Medicaid Spending Per Capita FY 2002-09 (2,378,484,000 population & $1,788,300,000,000 Medicaid spending) = $751.86 per person. Medicaid spending per capita FY 2010-2017 (2,536,990,138 population & $2,557,300,000,000 Medicaid spending) = $1,008 per person. Medicaid spending per capita FY 2018-2021 (1,318,440,949 population & $1,696,300,000,000 Medicaid Spending) = $1,286.59 per person. Medicaid Spending Per Capita FY 2022-23 (668,186,306 population & $1,027,600,000,000 Medicaid spending) = $1,537.89 per person. You can see how Medicaid spending on an inflation-adjusted basis & per capita has absolutely rocketed-up since 1970 & we saw a massive spike under Obama due to ObamaCare. Even those spending levels are chump change compared to the massive growth in the program since Obama left office. Yet, [X] we constantly hear about Medicaid being on the chopping block, it’s like a rite of passage – trust funder & Low-testosterone troglodyte Sam Seder #samseder #majorityreport & vanilla midget Brian Tyler Cohen dutifully repeat, “The Republicans are going to cut Social Security, the Republicans are going to cut Medicare.” Yet, no reform ever happens, it’s a scare tactic. If David Pakman said it, it would sound like “Wepubwicans are gonna cut your Medicare.” For the record, I think David Pakman is a little slow. It’s time to block grant this program & set it on a trajectory to give it to the states, much like Education should be left to the states, not a federal task. Medicaid is on a trajectory to absolutely blow a hole in the budget, Democrats are going to keep asking for more & if you slow the rate of growth, that will be adjudged as “a cut.” [X] None of Sam Seder’s autistics or the underemployed lunch meat slicers on Brian Tyler Cohen’s channel know any of this. They’ve been duped. My job is to inform those on the fence, so they don’t get fooled. They don’t want Medicaid reform, they want Medicaid expansion so they can increase the permanent underclass, but I doubt the trust fund daddy left Sam Seder (and he only got his job at Err America because of daddy, but daddy couldn’t force people to listen, which is why it went belly-up) will be affected. How about the trajectory of “other means tested entitlements”? (Table 8.3) We’ll run it the same way we did Medicaid. If you want to know encompasses “Other Means Tested Entitlements”, https://web.archive.org/web/20240714175210/https://www.whitehouse.gov/wp-content/uploads/2024/03/hist_intro_fy2025.pdf that will assist you. “Other Means Tested Entitlements” as a % of all Federal Outlays FY 1970-2023 = 6.472% “Other Means Tested Entitlements” as a % of all Federal Outlays FY 1978-81 (Jimmy Carter) = 5.2% “Other Means Tested Entitlements” as a % of all Federal Outlays FY 1982-89 (Ronald Reagan) = 4.45% “Other Means Tested Entitlements” as a % of all Federal Outlays FY 1994-2001 (Bill Clinton) = 6.35% “Other Means Tested Entitlements” as a % of all Federal Outlays FY 2020-09 (George W. Bush) = 6.787% “Other Means Tested Entitlements” as a % of all Federal Outlays FY 2010-17 (Barack Obama) = 8.425% “Other Means Tested Entitlements” as a % of all Federal Outlays FY 2018-21 (Donald J. Trump) = 10.25% [NOTE: As you may have noticed, much of the spike under Trump was due to COVID & the spendathon that started in late FY 2020 & into FY 2021] “Other Means Tested Entitlements” as a % of all Federal Outlays FY 2022-23 (Joe “The Nonce” Biden) = 9.2% Now another metric, “Other Means Tested Entitlements” spending (Table 8.2) adjusted for inflation: “Other Means Tested Entitlements” spending adjusted for inflation (FY2017$) FY 1970-2023 per year average = $192.461 (Billions) “Other Means Tested Entitlements” spending adjusted for inflation (FY2017$) FY 1978-81 average (Jimmy Carter) = $79.45 (Billions) “Other Means Tested Entitlements” spending adjusted for inflation (FY2017$) FY 1982-89 average (Ronald Reagan) = 82.75 (Billions) “Other Means Tested Entitlements” spending adjusted for inflation (FY2017$) FY 1994-01 average (Bill Clinton) = $147.625 (Billions) “Other Means Tested Entitlements” spending adjusted for inflation (FY2017$) FY 2002-09 average (George W. Bush) = $211.687 (Billions) “Other Means Tested Entitlements” spending adjusted for inflation (FY2017$) FY 2010-17 average (Barack Obama) = $319.275 (Billions) “Other Means Tested Entitlements” spending adjusted for inflation (FY2017$) FY 2018-21 average (Donald J. Trump) = $561.425 (Billions) “Other Means Tested Entitlements” spending adjusted for inflation (FY2017$) FY 2022-23 average (“Creepy” Joe Biden) = $487.9 (Billions) [NOTE: Prior to WWII, when spending levels would spike because of a “crisis” or a war, soon after they would taper-off & the pols would at least try to get them back close to pre-crisis levels. Look at the spending under Biden & even Donald Trump, it’s well beyond Obama-era levels, they don’t want to go back, so they’re autistically repeating, “Medicaid is being cut, Republicans are cutting the welfare safety net.” It’s all B.S] Now, let’s run the numbers, “Other Means Tested Entitlements” spending per capita: “Other Means Tested Entitlements” spending per capita FY 2000-23 average (7,473,134,960 population & $7,783,200,000,000 in inflation-adjusted spending) = $1,041.49 per person “Other Means Tested Entitlements” spending per capita FY 2002-09 average (2,378,484,000 population & $1,693,500,000,000 inflation-adjusted spending) = $712 per person “Other Means Tested Entitlements” spending per capita FY 2010-17 (2,536,990,138 population & $2,554,200,000,000 inflation-adjusted spending) average = $1,006.78 per person “Other Means Tested Entitlements” spending per capita FY 2018-21 (1,318,440,949 population & $2,245,700,000,000 inflation-adjusted spending) = $1,703.29 per person “Other Means Tested Entitlements” spending per capita FY 2022-23 (668,186,306 population & $975,800,000,000 inflation-adjusted spending) = $1,460.37 per person I realize some of the gargantuan spending increases during COVID in FY2021 were signed by Joe Biden, but I’m not going through the rigmarole to try & separate it – unfortunately Trump was hoodwinked by Congress & the screeching from lunatics who wanted to use COVID to institute a Chinese-style totalitarian society & spending went into overdrive. Medicaid & “Other Means Tested Entitlements” are 18.9% of all federal outlays currently & were only one-eighth (12.512%) of all federal outlays during the Bill Clinton regime. Can you see how this is not sustainable? Bill Clinton left the Oval Office only 24 years ago, he’s still alive – we are not talking about Presidents who lived to a ripe old age & have been in the ground for decades. Get it? We’re not even talking about Social Security, Medicare, the Pentagon Base Budget (Plus OCO) & interest payments on the debt……. Yet. The Bernie Sanders’ & Elizabeth Warren’s of the world do not care, they have an agenda & I wonder if that includes lot of canned goods when the dollar collapses? Both of those relics will likely be in the ground when that happens, but the rest of us would rather not have that experience. This is why Medicaid should be block-granted to the states & eventually turned over to them entirely to stifle the Democrat plan to create a permanent underclass large enough to vote them into power long enough to stack the SCOTUS, take away firearms & have ballots mailed out to everyone willy-nilly. How much has federal spending en masse increased? This will further show you how much Medicaid & like programs have exploded & you’ll either laugh or get pissed off when you hear a GroomerCrat lie about “Republicans cutting these programs.” Total Federal Outlays (Table 8.2) adjusted for inflation (FY2017$) FY 1970-2023 per year average = $2,696.741 (Billions) Total Federal Outlays adjusted for inflation (FY2017$) FY 1978-81 = $1,655.875 Total Federal Outlays adjusted for inflation (FY2017$) FY 1982-89 = $1,960 Total Federal Outlays adjusted for inflation (FY2017$) FY 1994-01 = $2,416.212 [NOTE: This is still well below the 1970-2023 average; the following will demonstrate the explosion in spending by Washington] Total Federal Outlays adjusted for inflation (FY2017$) FY 2002-09 = $3,151.125 Total Federal Outlays adjusted for inflation (FY2017$) FY 2010-17 = $3,788.562 Total Federal Outlays adjusted for inflation (FY2017$) FY 2018-21 = $5,200.475 Total Federal Outlays adjusted for inflation (FY2017$) FY 2022-23 = $5,260.95 (Billions) That’s 5 TRILLION & a lot of change! That should be an eye-opener, now for Total Federal Outlays per capita (Table 8.2), adjusted for inflation, 2000-2023: FY 2000-23 average (7,473,134,960 population & $91,926,200,000,000 in spending) = 12,300.88 per person in FY 2017 constant dollars. Total Federal Outlays per capita, adjusted for inflation FY 2002-09 (2,378,484,000 population & $25,209,000,000,000 spending) = $10,598.76 per person Total Federal Outlays per capita, adjusted for inflation FY 2010-17 (2,536,990,138 population & $30,308,500,000,000 spending) = $11,946.63 per person Total Federal Outlays per capita, adjusted for inflation FY 2018-21 (1,318,440,949 population & $20,801,900,000,000 spending) = $15,777.65 per person Total Federal Outlays per capita, adjusted for inflation FY 2022-23 (668,186,306 population & $10,521,900,000,000 spending) = $15,746.95 per person in FY 2017 constant dollars. **Federal Spending Per Capita, adjusted for inflation is >48.5% HIGHER than during the FY 2002-2009 period. Think about that for a minute ** Democrats don’t even want to return us to FY 2019 spending, that will be seen as “a cut” & that would be a lie – most of them know it’s a lie, but they have an agenda. Now do you see the massive growth in Medicaid & “Other Means Tested Entitlements” spending in relation to the entire budget? The entire budget has exploded, those two spending categories have sprinted past that growth rate. Why have those programs grown so rapidly? Part of the reason is the breakdown of the nuclear family https://rumble.com/playlists/JaxVTLucdl0 in these United States, which has led to a lot of people (I know, there are a lot of kids that grow up & succeed in a single-parent household, but it’s not the way it was intended. My father knows a guy that was a meth addict at one time & got out of that, but it’s not an ideal path to take) not participating in the labor force, enlarging the permanent underclass. That brings us to our next metric, the Labor Force Participation Rate. https://data.bls.gov/timeseries/LNS11300061 Let’s start w/ 25-54 Year Old Men: The Labor Force Participation Rate for Men 25-54, January 1950-December 1959 average = 97.135% Labor Force Participation Rate for Men 25-54, January 1970-December 1979 = 94.753% Labor Force Participation Rate for Men 25-54, January 1982-December 1988 = 93.82% Labor Force Participation Rate for Men 25-54, January 1994-December 2000 = 91.725% Labor Force Participation Rate for Men 25-54, January 2002-December 2008 average = 90.648% Labor Force Participation Rate for Men 25-54, January 2010-December 2016 = 88.573% Labor Force Participation Rate for Men 25-54, January 2018-December 2020 = 88.675% (The average was 89.03% from October 2017-February 2020, Trump had a good thing going & COVID-19 ruined it. Barack Obama’s first full calendar year in office (2010) the average was 89.233%) Labor Force Participation Rate for Men 25-54 January 2022-December 2024 average = 89.008% [NOTE: I did this in a way so there was no bridge between presidencies & started effectively a year into their term, so they can’t blame the last guy in office.] How about Men Aged 25-34? https://data.bls.gov/dataViewer/view/timeseries/LNS11300164Q Labor Force Participation Rate Men 25-34, Quarter 1 1950-Quarter 4 1959 average = 97.167% Labor Force Participation Rate Men 25-34, Q1 1970-Q4 1979 = 95.58% Labor Force Participation Rate Men 25-34, Q1 1982-Q4 1988 = 94.485% Labor Force Participation Rate Men 25-34, Q1 1994-Q4 2000 = 93.085% Labor Force Participation Rate Men 25-34, Q1 2002-Q4 2008 = 91.91% Labor Force Participation Rate Men 25-34, Q1 2010-Q4 2016 = 89.11% Labor Force Participation Rate Men 25-34, Q1 2018-Q4 2020 = 88.45% (It was 89.2% in the time frame comprising calendar years 2018 & 2019) Labor Force Participation Rate Men 25-34, Q1 2022-Q4 2024 average = 89.133% https://data.bls.gov/dataViewer/view/timeseries/LNS11300062 Labor Force Participation Rate, Women 25-54, January 1970-December 1979 average = 55.087% Labor Force Participation Rate, Women 25-54, January 1982-December 1988 = 69.517% Labor Force Participation Rate, Women 25-54, January 1994-December 2000 = 76.251% Labor Force Participation Rate, Women 25-54, January 2002-December 2008 = 75.526% Labor Force Participation Rate, Women 25-54, January 2010-December 2016 = 74.308% Labor Force Participation Rate, Women 25-54, January 2018-December 2020 = 75.486% (The rate was 75.675% from October 2017-February 2020) Labor Force Participation Rate, Women 25-54, January 2022-December 2024 = 77.244% You might be thinking, “Joe Biden did pretty good on Labor Force Participation.” I’ll have some data later demonstrating that’s not really true. Look at all that government spending & how it hasn’t done much to our flagging labor force participation rates since the 1950s. Let’s add, amend & update something I did years ago https://web.archive.org/web/20220801231231/https://professor_enigma.webs.com/sam-seder-aoc-tax-the-rich & calculate spending (Table 8.2) per 100,000 NONFARM Employment https://data.bls.gov/toppicks?survey=bls (Select “Total Nonfarm Employment - Seasonally Adjusted - CES0000000001”) Total Federal Inflation-Adjusted Outlays FY 1970-75 = $7,399,400,000,000 & Total Nonfarm Employment (in Thousands) during the same time frame (July 1, 1969 to June 30, 1975) was 5,343,489 – which equals 5,343,489,000 Total Nonfarm Jobs. That’s $138,475,067 spent per 100,000 Nonfarm jobs. We’ll use that as a baseline for this exercise. [NOTE: THIS IS FISCAL YEARS, keep that in mind!] Total Federal Inflation-Adjusted Outlays ($15,680,000,000,000) per 100,000 Nonfarm jobs (9,392,325,000) FY 1982-89 (10/1/81 to 9/30/89) = $166,944,819 Total Federal Inflation-Adjusted Outlays ($19,329,700,000,000) per 100,000 Nonfarm jobs (10,624,606,000) FY 1994-01 = $181,933,334 Total Federal Inflation-Adjusted Outlays ($25,209,000,000,000) per 100,000 Nonfarm jobs (11,400,659,000) FY 2002-09 = $221,118,796 Total Federal Inflation-Adjusted Outlays ($30,308,500,000,000) per 100,000 Nonfarm jobs (11,639,330,000) FY 2010-17 = $260,397,290 Total Federal Inflation-Adjusted Outlays ($20,801,900,000,000) per 100,000 Nonfarm jobs (7,053,343,000) FY 2018-21 = $294,922,563 (For FY 2018-19 that total was $231,588,908 per 100,000 nonfarm jobs: 3,584,714,000 jobs & $8,301,800,000,000. COVID did a lot of damage) Total Federal Inflation-Adjusted Outlays ($10,521,900,000,000) per 100,000 Nonfarm jobs (3,678,424,000) FY 2022-23 = $286,043,696 Now, let us https://www.bls.gov/charts/employment-situation/employment-levels-by-industry.htm utilize another metric to illustrate for you even more how much of a clusterfunk we’re in. We’re going to tally inflation-adjusted total federal outlays per 100,000 PRIVATE jobs. This will show us that creating paper-pushing jobs at government agencies will create jobs, but it doesn’t create wealth. We could raise the labor force participation rate by creating a few more Cabinet-level agencies in Washington, filling them w/ useless people like Sam Seder, but it wouldn’t do the economy much good. We could also have a few million unemployed people completely drop out of the labor force & that would raise the labor force participation rate, but it wouldn’t make the economy better. Using this metric, if you’re able to slow the growth of federal spending & have job creation in the private sector going well, you’ll have good results. Citing the unemployment rate is bogus, as well as using a high watermark for federal spending (as the Dems did in the first year of Obama) & claiming, “We’re reducing the deficit” is a façade. This metric only goes back to February 2005, so I’ll begin in FY 2006, beginning October 2005. Total Federal Inflation-Adjusted Outlays (Table 8.2) FY 2006-23 ($75,291,000,000,000) per 100,000 PRIVATE jobs (25,665,472,000) = $293,355,213 Total Federal Inflation-Adjusted Outlays ($30,308,500,000,000) FY 2010-17 per 100,000 PRIVATE jobs (11,078,724,000) = $273,573,924 Total Federal Inflation-Adjusted Outlays ($20,801,900,000,000) FY 2018-21 per 100,000 PRIVATE jobs (5,984,197,000) = $347,613,890 Total Federal Inflation-Adjusted Outlays ($8,301,800,000,000) FY 2018-19 per 100,000 PRIVATE jobs (3,044,917,000) = $272,644,542 Again, COVID-19 did a lot of damage, Trump had a great trajectory going prior to it. Total Federal Inflation-Adjusted Outlays ($10,521,900,000,000) FY 2022-23 per 100,000 PRIVATE jobs (3,141,568,000) = $334,925,107 Just to give you an idea of how much damage COVID-19 & the lockdowns did to our country (and Trump made some errors on that, he signed legislation putting spending into overdrive, he & Congress own it. Biden/Harris doubled-down on that) & anyone who cries about “Spending being cut” if out of their mind: Total Federal Inflation-Adjusted Outlays ($52,269,000,000,000) FY 2006-2019 per 100,000 PRIVATE jobs (19,584,624,000) = $266,887,942 If the Trump economy had been allowed to continue (and again, he owns some of it, but I think Trump 2.0 is a lot more savvy) we were on a trajectory to have a lot less spending per 100,000 PRIVATE jobs. If Joe Biden & his Congress had spent a few trillion more to have full-employment & most of those job were paper-pushers at the Pentagon, the Dept. of Education & a Federal Ministry of Truth – would that be a success? Much of this spending is baked into the budget, so even when Republicans win, the Democrats don’t lose because of baseline budgeting & so-called Mandatory Spending basically being on autopilot. We have to address this (so-called “Means Tested Entitlements” & #DOGE has to find & eliminate much of this fraud, waste & erroneous payments attached to many federal programs) or we are headed for a financial catastrophe. Now, back to the game. Now let’s use another metric, courtesy of the BEA. We’ll tally spending (with the limited data I have) per 100,000 FTEs (Full Time Equivalent Employees) in “PRIVATE INDUSTRIES.” https://apps.bea.gov/iTable/?reqid=19&step=2&isuri=1&1921=survey&_gl=1*1jbksft*_ga*NDc5NTAyMTExLjE3NDE2MDU3NzU.*_ga_J4698JNNFT*MTc0MTYwNTc3NS4xLjEuMTc0MTYwNTgxMy4yMi4wLjA.#eyJhcHBpZCI6MTksInN0ZXBzIjpbMSwyLDNdLCJkYXRhIjpbWyJDYXRlZ29yaWVzIiwiU3VydmV5Il0sWyJOSVBBX1RhYmxlX0xpc3QiLCIxOTUiXV19 archived https://archive.is/VvXOj 1980-1987 Table 6.5B. Full-Time Equivalent Employees by Industry https://apps.bea.gov/iTable/?reqid=19&step=2&isuri=1&1921=survey&_gl=1*1jbksft*_ga*NDc5NTAyMTExLjE3NDE2MDU3NzU.*_ga_J4698JNNFT*MTc0MTYwNTc3NS4xLjEuMTc0MTYwNTgxMy4yMi4wLjA.#eyJhcHBpZCI6MTksInN0ZXBzIjpbMSwyLDNdLCJkYXRhIjpbWyJDYXRlZ29yaWVzIiwiU3VydmV5Il0sWyJOSVBBX1RhYmxlX0xpc3QiLCIxOTYiXV19 archived https://archive.ph/pVoo9 1993-2000 Table 6.5C. Full-Time Equivalent Employees by Industry (SEE NOTES!) https://apps.bea.gov/iTable/?reqid=19&step=2&isuri=1&1921=survey&_gl=1*1jbksft*_ga*NDc5NTAyMTExLjE3NDE2MDU3NzU.*_ga_J4698JNNFT*MTc0MTYwNTc3NS4xLjEuMTc0MTYwNTgxMy4yMi4wLjA.#eyJhcHBpZCI6MTksInN0ZXBzIjpbMSwyLDNdLCJkYXRhIjpbWyJDYXRlZ29yaWVzIiwiU3VydmV5Il0sWyJOSVBBX1RhYmxlX0xpc3QiLCIxOTciXV19 archived https://archive.ph/EX3BB (it’s not exactly archiving correctly) Table 6.5D. Full-Time Equivalent Employees by Industry 2016-2023. If you want to look at years in smaller chunks & going back further than 1998 This is the one I will use & will include screenshots from the Excel for you https://apps.bea.gov/iTable/?reqid=19&step=2&isuri=1&1921=survey&_gl=1*1jbksft*_ga*NDc5NTAyMTExLjE3NDE2MDU3NzU.*_ga_J4698JNNFT*MTc0MTYwNTc3NS4xLjEuMTc0MTYwNTgxMy4yMi4wLjA.#eyJhcHBpZCI6MTksInN0ZXBzIjpbMSwyLDMsM10sImRhdGEiOltbIkNhdGVnb3JpZXMiLCJTdXJ2ZXkiXSxbIk5JUEFfVGFibGVfTGlzdCIsIjE5NyJdLFsiRmlyc3RfWWVhciIsIjE5OTgiXSxbIkxhc3RfWWVhciIsIjIwMjMiXSxbIlNjYWxlIiwiLTMiXSxbIlNlcmllcyIsIkEiXSxbIlNlbGVjdF9hbGxfeWVhcnMiLCIxIl1dfQ== 1998-2023 & from everything I was able to read from the BEA regarding reporting requirements, I believe this is done under the auspices of Federal Government Fiscal Years, ending September 30. https://archive.is/ZzvyT https://archive.is/ZzvyT/271aae678d8b255ae4b619b5ad0f10c1055940a3.jpg Total Federal Inflation-Adjusted Outlays ($96,809,900,000,000) FY 1998-2023 (Table 8.2) per 100,000 PRIVATE Full-Time Equivalent Employees (2,829,639,000) = $3,421,280,947 Total Federal Inflation-Adjusted Outlays FY 2002-09 ($25,209,000,000,000) per 100,000 PRIVATE Full-Time Equivalent Employees (837,921,000) = $3,008,517,509 Total Federal Inflation-Adjusted Outlays FY 2010-17 ($30,308,500,000,000) per 100,000 PRIVATE Full-Time Equivalent Employees (864,701,000) = $3,505,084,416 Total Federal Inflation-Adjusted Outlays FY 2018-21 ($20,801,900,000,000) per 100,000 PRIVATE Full-Time Equivalent Employees (469,269,000) = $4,432,830,636 Total Federal Inflation-Adjusted Outlays FY 2018-19 ($8,301,800,000,000) per 100,000 PRIVATE Full-Time Equivalent Employees (238,913,000) = $3,474,821,378 Total Federal Inflation-Adjusted Outlays ($10,521,900,000,000) FY 2022-2023 per 100,000 PRIVATE Full-Time Equivalent Employees (247,790,000) = $4,246,297,267 The COVID-19 spendathon did a lot of damage kids & the Democrats are going to try & categorize a rolling-back of that spending as “a cut”, when it is not. Joe Biden was spending 771 million more taxpayer dollars per 100,000 FTEs than Trump was when the economy was humming, prior to COVID bringing it to a screeching halt for about half of 2020. We dug ourselves a big hole. Let us run more experiments to hammer this home & you will see. Table 8.3 will be utilized again & let’s see what the % of all federal outlays is so-called DISCRETIONARY SPENDING. FY 1970-2023 average % of all Federal Outlays that is Discretionary Spending = 39.745% FY 1978-81 average % of all Federal Outlays that are Discretionary Spending = 46.875% FY 1982-89 average % of all Federal Outlays that are Discretionary Spending = 43.825% FY 1994-01 average % of all Federal Outlays that are Discretionary Spending = 34.675% FY 2002-09 average % of all Federal Outlays that are Discretionary Spending = 37.837% FY 2010-17 average % of all Federal Outlays that are Discretionary Spending = 34.2% FY 2018-21 average % of all Federal Outlays that are Discretionary Spending = 27.4% FY 2018-19 average % of all Federal Outlays that is Discretionary Spending = 30.4% FY 2022-23 average % of all Federal Outlays that is Discretionary Spending = 27.25% [NOTE: There are federal programs that bridge MANDATORY & DISCRETIONARY spending. E.G. “National Defense” has some small outlays under the Mandatory category. In addition, there’s likely a lot of waste under “Discretionary” spending, so it needs to be seriously evaluated as well.] The massive growth in Federal Spending has been fueled largely by so-called “Mandatory Programs.” Many of those could be block-granted & eventually left to the states, so jurisdictions that take advantage of economic downturns (COVID, housing crash) wouldn’t be sucking off the federal teat & costing everyone else a lot of money we don’t have. #DOGE *** [X] Medicaid is always being cut, even when it isn’t & other Communist caterwauling https://www.americanhealthlaw.org/content-library/journal-health-law/article/1ace7226-252b-43c8-a52d-960a4dd3df8f/The-Ongoing-Racial-Paradox-of-the-Medicaid-Program Medicaid is racist, there’s never enough funding & I’d wager to make it anti-racist will cost a lot more money. Medicaid spending per capita, adjusted for inflation has only more than doubled since the George W. Bush Administration & adjusting for inflation, Medicaid spending was >220% HIGHER under Barry Obama than it was under Bill Clinton. Since Obama, Medicaid spending adjusted for inflation has increased >60% under Biden. Yet, it’s being cut. They think you’re stupid. https://link.springer.com/article/10.1007/s40615-015-0113-z More whining about racial disparities, all this government spending has only benefitted White folks. I guess the COVID virus was also racist, it avoided Asian folks (and largely, White folks too), but sought out Blacks & AI/AN people. https://rumble.com/v2rgw38-covid-19-lockdowns-get-nuked.html No funding is ever enough, they intend to keep spending until your dollar is worthless, they intend to make you a ward of the state by demolishing your nest egg. They want Medicaid to be a catch-all for all their programs – paying for everyone’s birth control & gender reassignment/.transgender lunacy https://www.ama-assn.org/practice-management/medicare-medicaid/federal-funding-medicaid-program-should-not-be-capped-ama https://www.kff.org/medicaid/report/the-cost-of-not-expanding-medicaid/ https://www.nytimes.com/roomfordebate/2015/07/13/birth-control-on-demand/publicly-funded-birth-control-is-crucial https://healthlaw.org/resource/10-advocacy-steps-to-support-a-medicaid-expansion-in-your-state/ Leo Cuello needs an economics class, Medicaid expansion is not free dummy. Get a load of this: “Some state leaders will try and throw out big cost numbers instead of talking about the small percentage of spending that the costs represents. So instead of saying our state will only pay 4% more. They’ll say something like: this will cost the state $10 billion dollars over the next decade. That number sounds big, but it doesn’t tell you how much money that is compared to the overall budget. For example, $10 billion over a decade is only $ 1 billion a year. And if the state’s Medicaid budget is $25 billion a year, than $1 billion would only be a 4% increase.” That’s precisely why we are in the mess we’re in right now. 10 billion here, 10 billion there, 5 billion here. He also says this, “You will probably hear complaints that providing Medicaid Expansion coverage is too expensive. But, know the facts. Fact: Medicaid is the least expensive health insurance program in the country. Fact: Medicaid is by far the least expensive way to cover low income individuals, and is far less expensive than providing coverage in the Exchange.” Yes, even the Gulf of Mexico, er Gulf of America looks small when compared to the Pacific Ocean. I guess Leo Cuello doesn’t think Medicaid is racist though, that’s encouraging. Lastly, he says, “It is true that the Medicaid Expansion, by covering new people, will create some new costs to states. However, a lot of conservative state leaders are using fuzzy math to exaggerate the cost. For example, one thing they are doing is counting people who are already eligible for Medicaid in the Medicaid Expansion costs. Any time a new program starts, it generates attention, and some people who are already eligible but somehow weren’t enrolled for existing programs may try and enroll. This is not a cost of the Medicaid Expansion it’s the result of the state under-enrolling the existing Medicaid program to begin with! And note: no matter what, the state Exchanges will also be starting up in 2014, so all of these lost individuals will be identified at that time and end up entering the Medicaid program even if the state doesn’t take the Medicaid Expansion. Another popular trick is to assume that 100% of eligible individuals will enroll (meaning higher costs), even though in reality statistics show that on average 63% of individuals in programs such as this actually enroll. 5 You will need to correct the false information:The Governor quotes a cost of $3 billion dollars, but that includes $1 billion dollars for people who were already eligible and the state had simply failed to enroll.” It must not be that great a program if a third of those eligible don’t even bother. And if the Medicaid Expansion is going to cost less because some of those eligible will finally enroll, why the hell is the money being doled out then? Leo has no business sense whatsoever. https://www.healthinsurance.org/blog/the-inevitable-expansion-of-the-medicaid-expansion/ The ObamaCare Medicaid Expansion was a road to single-payer health care & the federal government makes it essentially free to all 50 states, so why not? https://www.americanprogress.org/article/medicaid-give-it-another-40/ I guess Medicaid isn’t racist? The piece talks about cuts to Medicaid, which are simply cuts in growth – not a new talking point from collectivists. And of course, it’s a single-payer Trojan Horse. https://www.commonwealthfund.org/publications/other-publication/2005/sep/medicaid-next-40-years This piece inadvertently points out that government health care has caused a cultural crisis, why is it celebrated that one-third of births (at that time) are to mothers are covered by Medicaid? It’s an expansion of the permanent underclass, which is what the Democrats want. The author says Medicaid spending surpasses Medicare, not sure where that’s coming from. He also says Medicaid is “chronically underfunded” & that is a lie. He may be so stupid he doesn’t know this. No spending is ever enough! Next… https://www.cbpp.org/sites/default/files/archive/2-18-05health.htm https://www.nbcnews.com/id/wbna11237564 https://www.cbsnews.com/news/medicaid-cut-to-balance-budgets/ https://www.npr.org/2005/02/08/4490212/budget-plan-would-dramatically-cut-medicaid-costs Again, Medicaid reductions in growth (baseline budgeting) masquerading as “cuts” to the program. Again, NO spending is enough, it will never be enough. https://psychiatryonline.org/doi/10.1176/pn.43.3.0007a With Leviathan footing the majority of the bill, why not expand Medicaid? https://www.cbpp.org/research/losing-out-states-are-cutting-12-to-16-million-low-income-people-from-medicaid-schip-and https://www.nytimes.com/2003/04/21/us/states-facing-budget-shortfalls-cut-the-major-and-the-mundane.html Aren’t we always in a budget crisis & aren’t states always cutting budgets? It’s oft-repeated scaremongering. States can’t print money & desecrate the fiat currency, Leviathan can – and Leviathan will dangle carrots (we’ll pay for the full expansion for the fist 3 years, it’s free!) to get you to bend the knee. What happens when Leviathan runs out of money? Essentially, we’ve been out of money for a very long time & there will be consequences if we do not reverse course. DOGE, are you listening? https://www.nytimes.com/2003/03/03/nyregion/new-york-which-made-medicaid-big-looks-to-cut-it-back.html Sometimes the pols find out when you engage in vote-buying schemes, the money will run out & states cannot print money. https://www.healthaffairs.org/content/forefront/myths-medicaid-expansion-and-able-bodied Argues that few Medicaid recipients are in good health but not working, but Dems still oppose work requirements for those that can289 views 22 comments -
Federal Spending Odds & Ends (Defense, Entitlements, Foreign Aid) #DOGE
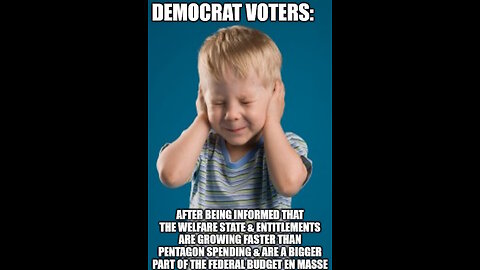
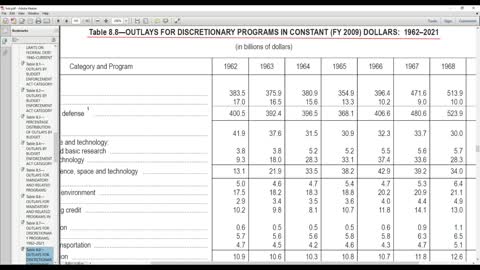
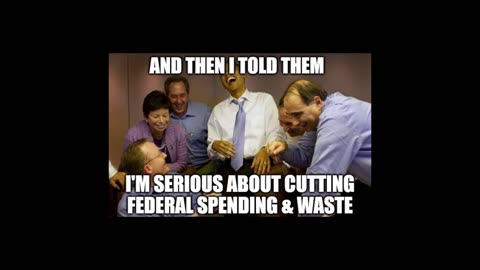
UTubekookdetectorFederal Spending Odds & Ends (Defense, Entitlements, Foreign Aid) #DOGE DOGE you know how to cut federal spending? Federal Spending data https://web.archive.org/web/20240705083452/https://www.whitehouse.gov/omb/budget/historical-tables/ https://web.archive.org/web/20241130122049/https://www.whitehouse.gov/wp-content/uploads/2024/03/hist_fy2025.zip https://web.archive.org/web/20241228032104/https://www.whitehouse.gov/wp-content/uploads/2024/03/hist08z3_fy2025.xlsx https://web.archive.org/web/20241229072453/https://www.whitehouse.gov/wp-content/uploads/2024/03/hist08z8_fy2025.xlsx https://web.archive.org/web/20241208132545/https://www.whitehouse.gov/wp-content/uploads/2024/03/hist08z2_fy2025.xlsx *** U.S. Population Data https://www.census.gov/data/datasets/time-series/demo/popest/2020s-counties-total.html https://www.census.gov/data/datasets/time-series/demo/popest/2010s-counties-total.html https://www2.census.gov/library/publications/2011/compendia/statab/131ed/2012-statab.pdf *** In this edition I’m going to cover Defense Spending, Medicare & Social Security spending Let’s go to Table 8.3 first & tally what % of all federal outlays (if you want to see how much federal outlays have grown adjusted for inflation & other data, see https://rumble.com/playlists/IIv11M6lVOE) are “National Defense.” FY 1970-2023 average = 21.414% * FY 1982-89 average = 26.75% * FY 1994-2001 = 17.1% * FY 2002-09 = 19.35% * FY 2010-17 = 17.4% * FY 2018-2023 = 12.883% You can see how it plummeted relative to the Ronald Reagan era & if you followed my series on this, you know that before I posted it. That doesn’t mean there isn’t substantial waste at the Pentagon. I’d wager there are a lot of redundancies & a lot of paper-pushers that are unnecessary, it just means spending on “National Defense” is NOT growing as fast as the budget en masse. I would also negate ALL foreign aid, as Ron Paul has wanted to do since… forever. How about Social Security & Medicare spending combined as a percentage of the entire budget (Table 8.3)? FY 1970-2023 average = 30.132% * FY 1982-89 average = 27.112% * FY 1994-01 average = 33.424% * FY 2002-09 = 33.162% * FY 2010-17 average = 36.7% * FY 2018-23 average = 32.966% I tallied them together, but if you do this yourself, you’ll see that Medicare is catching-up w/ Social Security as a % of all spending. The only reason those programs collectively fell from FY 2018-23, relative to Barack Obama (FY2010-17) was the growth in “other means-tested entitlements” & other federal giveaways that began during the COVID-19 plandemic in FY 2020. Not turn to Table 8.8 & we will tally “Total National Defense” (“DoD-Military (051)” and “Other Defense”) outlays, adjusted for inflation. FY 1970-2023 average = $533.51 Billion * FY 1982-89 average = $547.737 Billion * FY 1994-2001 average = $455.287 * FY 2002-09 average = $614.287 Billion * FY 2010-17 average = $654.312 Billion * FY 2018-23 average = $654.966 Billion See how it declined under Bill Clinton (FY 1994-01) & then exploded again? However, those who say defense spending has done nothing but grow (relative to inflation) & insinuate it’s the biggest part of the budget are mistaken. I’ll be generous & say they’re retarded. Let’s look at “National Defense” spending per capita, FY 2000-2023 (Table 8.2, adjusted for inflation). [NOTE: Table 8.2 & Table 8.8 have the same data, just broken down differently] FY 2000-23 average = (7,473,134,960 population & $14,986,500,000,000 spending) $2,005.38 per capita. FY 2002-09 average = (2,378,484,000 population & $4,914,300,000,000 spending) $2,066.14 per capita FY 2010-17 average = (2,536,990,138 population & $5,234,500,000,000) $2,063.27 per capita FY 2018-2023 average = (1,986,627,255 population & $3,929,800,000,000) $1,978.12 per capita. Well golly gee, I thought the Pentagon was the only portion of the federal budget rising faster than inflation & everything else was falling. I thought Medicaid was being eradicated, along w/ our generous (and ineffective) welfare state. Well, I guess that’s not true. It’s akin to polls taken during the early 2000s & years following – the plebs usually thought crime was rising, but that’s not true. Perception does not equal reality. U.S. Population 2000 = 282,172,000 * 2001 = 285,082,000 * 2002 = 287,804,000 * 2003 = 290,326,000 * 2004 = 293,046,000 * 2005 = 295,753,000 * 2006 = 298,593,000 * 2007 = 301,580,000 * 2008 = 304,375,000 * 2009 = 307,007,000 * 2010 = 308,745,538 * 2011 = 311,556,874 * 2012 = 313,830,990 * 2013 = 315,993,715 * 2014 = 318,301,008 * 2015 = 320,635,163 * 2016 = 322,941,311 * 2017 = 324,985,539 * 2018 = 326,687,501 * 2019 = 328,239,523 * 2020 = 331,464,948 * 2021 = 332,048,977 * 2022 = 333,271,411 * 2023 = 334,914,895 * Grand Total = 7,473,134,960 Let’s tally Social Security & Medicare spending per capita (Table 8.2), 2000-2023 & see what we find, eh? FY 2000-2023 average (7,473,134,960 population & $31,155,900,000,000 spending) = $4,169.05 per capita. Oh noes, that’s >200% higher than the Pentagon, how can that be? FY 2002-09 average (2,378,484,000 population & $8,223,200,000,000 spending) = $3,457.32 per capita FY 2010-17 average (2,536,990,138 population & $11,122,100,000,000 spending) = $4,383.97 per capita FY 2018-2023 average (1,986,627,255 population & $10,150,000,000,000 spending) = $5,109.16 per capita. Who’d thunk it? Social Security & Medicare, combined with Medicaid & “Other Means Tested Entitlements” are roughly 53% of the entire federal budget by themselves. But “we don’t take care of people; we just build missiles.” Yes, there is waste at the Pentagon & our Founders were not fans of a standing army (our Navy needs to be robust enough to make 99% of evil actors say, “we don’t want any trouble”), but to say we spend the bulk of our taxpayer money on the Pentagon is beyond insane. It comes from people who just read headlines & never actually look. Shut off MSLSD & read something. Take your Ritalin too! Since I’m going to debunk some anti-Semites in the near future (I’m with Ron Paul, ALL foreign aid should be axed. It’s one of the main reasons I voted for him in the 2012 Iowa Caucus – there are a lot of screeching banshees who can’t name any foreign aid recipients, except for Israel), let’s take a gander at spending on “International Affairs.” I will be utilizing Table 8.8 for this. [NOTE: Table 3.2 is NOT adjusted for inflation but will give you an idea as to what encompasses foreign aid/international affairs. In addition, Table 3.2 adjusts the total by subtracting “International Financial Programs” receipts, I will just include the totals in Table 8.8 for this exercise] International Affairs FY 1970-2023 average yearly spending, adjusted for inflation = $40.115 BILLION International Affairs FY 2000-23 average yearly spending, adjusted for inflation = $48.508 BILLION International Affairs FY 2010-17 average yearly spending, adjusted for inflation = $51 BILLION International Affairs FY 2018-23 average yearly spending, adjusted for inflation = $56.683 BILLION Now let’s see that per capita, shall we? We’re still on Table 8.8 kids. International Affairs spending per capita, adjusted for inflation FY 2000-2023 (7,473,134,960 population & $1,164,200,000,000 spending) = $155.78 per capita International Affairs spending per capita, adjusted for inflation FY 2002-09 (2,378,484,000 population & $350,300,000,000 spending) = $147.27 per capita International Affairs spending per capita, adjusted for inflation FY 2010-2017 (2,536,990,138 population & $408,000,000,000 spending) = $160.82 per capita International Affairs spending per capita, adjusted for inflation FY 2018-2023 (1,986,627,255 population & $340,100,000,000 spending) = $171.19 per capita Not a big chunk of the budget & whatever direct foreign aid to Israel in the form of munitions, etc. is a tiny portion of that (but when you’re mentally ill, Israel is the hammer & everything looks like a nail) just so you know. However, as I said earlier, there are a bevy of “it’s not much of the federal budget” programs that have gotten us into this mess. Do you want the dollar to collapse? Do you want to travel to the store & find empty shelves, as happened in the Soviet Union & Yugoslavia, two entities that no longer exist? If not, then write to your elected officials NOW if you haven’t & tell them you support #DOGE finding this waste & Congressional rescission packages to end this. There’s a lot of low-hanging fruit (no offence intended Sam Seder) & a lot of unconstitutional spending that needs to end now. Do you want your grandchildren to experience an economic collapse? Me neither. In my (hopefully? Maybe?) final video in this Federal Spending #DOGE series, I’m going to look at another economic harbinger – interest payments on the debt. If you find this worthy, pass it on! Mr. Chairman, I Yield Back! Here are the two votes Senator Rand Paul was talking about https://www.senate.gov/legislative/LIS/roll_call_votes/vote1191/vote_119_1_00132.htm https://www.senate.gov/legislative/LIS/roll_call_votes/vote1191/vote_119_1_00077.htm see how your Senators voted I think it's time Chuck Grassley retired85 views 1 comment -
Mariannette Miller-Meeks triggers mentally ill Iowa City Democrats #DOGE
UTubekookdetectorMariannette Miller-Meeks triggers mentally ill Iowa City Democrats: They see their taxpayer-funded, unaccountable gravy train ending. The relevant sources NIH waste, NIH funding (the first 2 links feature waste from many govt agencies, NIH included) https://web.archive.org/web/20220615031448/https://professor_enigma.webs.com/old-fart-rants-4 https://web.archive.org/web/20231001191515/https://professor_enigma.webs.com/oldfartrants2.htm https://report.nih.gov/nihdatabook/category/1 https://officeofbudget.od.nih.gov/pdfs/FY25/spending_hist/Mechanism%20Detail%20for%20Total%20NIH%20FY%202000%20-%20FY%202023%20(V).pdf https://report.nih.gov/nihdatabook/page/historical-data-books https://www.paul.senate.gov/?s=National+Institutes+of+Health Federal Spending data https://web.archive.org/web/20240705083452/https://www.whitehouse.gov/omb/budget/historical-tables/ https://web.archive.org/web/20241128153942/https://www.whitehouse.gov/wp-content/uploads/2024/03/hist04z2_fy2025.xlsx https://web.archive.org/web/20241130122049/https://www.whitehouse.gov/wp-content/uploads/2024/03/hist_fy2025.zip https://web.archive.org/web/20241229072453/https://www.whitehouse.gov/wp-content/uploads/2024/03/hist08z8_fy2025.xlsx https://web.archive.org/web/20241228032211/https://www.whitehouse.gov/wp-content/uploads/2024/03/hist08z6_fy2025.xlsx https://web.archive.org/web/20241230073255/https://www.whitehouse.gov/wp-content/uploads/2024/03/hist09z7_fy2025.xlsx https://web.archive.org/web/20250116091656/https://www.whitehouse.gov/wp-content/uploads/2024/03/hist12z1_fy2025.xlsx ******* Recently, Johnson County, Iowa NAMBLA Groomers held a “townhall” https://www.facebook.com/jcdemsiowa/posts/959939839593544/ https://www.1630kcjj.com/2025/03/21/ic-federation-of-labor-to-hold-town-hall-saturday/ to rage over NIH waste being preserved (most of them don’t pay a dime in federal income taxes, so they have no skin in the game) because what would we do if we didn’t have “hair research” or figuring out why people like spicy foods – you know, the burning questions that everyone wants answered. I’d wager a good portion of the attendees are likely dependent on taxpayer subsidies to the HHS & NIH, so if this waste & this frivolous spending gets taken behind the woodshed, they might have to get a real job where they get paid to do something noble in the private sector. Pedocrats have always sought to expand the size of government, not just to exert control over the plebs, but to increase the share of folks who will vote for them – as well as mobilizing these clowns when Donald J. Trump, Elon Musk & “Big Balls” start looking through the federal budget & find what we all knew they would find (I do have to admit, even I didn’t think it was this bad). When you make people dependent on government & others come along & try to avoid the collapse of the dollar due to our bloated national debt – it’s hard to get these people off of that. It’s like a drug addiction & treatment; you need some tough love. I urge you to write your elected officials now & tell them you support #DOGE & a reining-in of wasteful spending (see the links at the top, I did that almost 10 years ago & that’s just the tip of the iceberg) at NIH, HHS & ending the federal department of “education.” In this exercise, I’m going to cover (because I’ve been queried about it numerous times) education spending, HHS spending & NIH spending/waste (but mostly the latter). I often hear “education is underfunded” & the details following are non-existent. If you constantly claim that “education is underfunded” {X} when the results are not positive, you autistically-repeat “education is underfunded,” wash, rinse & repeat. I remember right after Barry Obongo signed the American Recovery & Reinvestment Act into law & the ink was barely dry when Collectivists started wondering, “was it big enough? Did we spend enough money?” It’s never enough, get it? Turning to Table 4.2 (the Federal Dept. of “Education” in its current iteration did not exist prior to Peanut Head Jimmy Carter’s regime, but spending was still allocated towards that), from 1980-2000, 1.923% of all federal spending was “The Federal Department of Education.” If the groomer says, “see, it’s less than 2%, that’s not much.” I’ll retort, “If ONLY 1.923% of the Pacific Ocean was dumped on your hovel, it wouldn’t be much of the Pacific Ocean but would still cause widespread damage.” Get it? From FY 2010-17, the Federal Department of Education was 2.025% of all federal outlays. From FY 2018-21 it was 2.7% & in FY 2022-23 it was 4.75%. Under Ronald Reagan (FY1982-89) it equaled 1.812%. Why is that important? The Federal Budget en masse has absolutely exploded over the past 50+ years, I have the data in a previous video >>> https://rumble.com/v6qiakw-lyin-brian-tyler-cohen-is-really-worried-about-medicaid-spending.html Agency X could see its share of all federal spending (adjusted for inflation) decrease in a decade, but that doesn’t necessarily mean its funding is being cut, it’s just not growing as fast that the entire budget. All the money Leviathan spends on “Education” (unless it is the District of Columbia, as it is a federal enclave) should be returned to the taxpayers & Iowa can educate its children, so can Idaho & every other state sans any “assistance” from Leviathan. Unfortunately, they don’t have a table that looks at agency spending adjusted for inflation, but Table 4.1 does show you the yearly totals. Table 4.2 is all you need though to know how much it has grown. If you wander over to Table 8.8 (inflation-adjusted), “Total education, training, employment and social services” spending averaged “only” $55.112 Billion from FY 1982-89. FY 2010-17 it had grown to $105.787 Billion & FY 2018-23 it shrunk to $102.533 billion. Still >86% larger on an inflation-adjusted basis when compared to the Reagan presidency. They would call it a cut if it grew at the rate of inflation until Jesus comes back. Turning again to Table 4.2, “Department of Health and Human Services” averaged 18.58% of all federal outlays, FY 1970-2023. From 1982-89 HHS was 12.475% of ALL federal outlays, FY 1994-01 it was 20.925% & FY 2010-17 it was 26.275%. FY 2018-2023 HHS was “only” 25.516% of all federal outlays. Again, if you go to https://rumble.com/v6qiakw-lyin-brian-tyler-cohen-is-really-worried-about-medicaid-spending.html (I have the population data there) & peruse the data, you will see HHS is growing much faster than the federal budget en masse & the federal budget en masse since the 1970s has been in overdrive. So, if anyone complains about HHS cuts, they’re either lying or very stupid. I’ll be generous & say they’re stupid. How about HHS spending per capita? I can’t give you a definitive total on that, but going to Table 8.6 will get us close. I will be adding lines 13 (which has a number of items under it) & 14. I will also be adding lines 28 & 29 (“Health” + “Medicare” on the Discretionary side) on Table 8.8. From FY 2000-23 ($22.4105 TRILLION & 7,473,134,960 population) those metrics (“Total Health” + “Medicare”) averaged $2,998.80 per capita, adjusted for inflation. From FY 2010-17 (2,536,990,138 population & $7,845,600,000,000 in spending) those metrics (“Total Health” + “Medicare”) averaged $3,092.48 per capita, adjusted for inflation. From FY 2018-23 (1,986,627,255 population & $8,044,500,000,000 spending) those items (“Total Health” + “Medicare”) averaged $4,049.32 per capita, adjusted for inflation. No cuts there kids, not even close. I’m guessing the rubes whining about #science & NIH funding (which is under the auspices of HHS) being gutted have no clue about this spending, but they do have an entitlement mentality. Many of these #sciene lunatics also think Dylan Mulvaney, William Thomas & Tim McBride {Y} are women. No, they are dudes pretending to be women & they want you to take part in their psychosis. No thanks & if you want to do that fine, but as soon as you go into the women’s locker room, you will be arrested. Now, back to the game. Let’s go to Table 9.7 & see how “SUMMARY OF OUTLAYS FOR THE CONDUCT OF RESEARCH AND DEVELOPMENT” has fared over many years & only the “NONDEFENSE” total. FY 1970-2023 “SUMMARY OF OUTLAYS FOR THE CONDUCT OF RESEARCH AND DEVELOPMENT” (Nondefense) “as a percentage of total outlays” averaged 2.036%. Again, remember how much the federal budget en masse has grown since the 1970s. FY 2000-2023 “SUMMARY OF OUTLAYS FOR THE CONDUCT OF RESEARCH AND DEVELOPMENT” (Nondefense) “as a percentage of total outlays” averaged 1.695%. FY 2010-17 “SUMMARY OF OUTLAYS FOR THE CONDUCT OF RESEARCH AND DEVELOPMENT” (Nondefense) “as a percentage of total outlays” averaged 1.712%. FY 2018-2023 “SUMMARY OF OUTLAYS FOR THE CONDUCT OF RESEARCH AND DEVELOPMENT” (Nondefense) “as a percentage of total outlays” averaged 1.316%. Now let’s tally this spending (adjusted for inflation, Table 9.7) shall we? FY 1970-2023 “SUMMARY OF OUTLAYS FOR THE CONDUCT OF RESEARCH AND DEVELOPMENT” (Nondefense) “In Billions of Constant (FY 2017) Dollars” average yearly spending = $47.76 BILLION FY 2000-23 “SUMMARY OF OUTLAYS FOR THE CONDUCT OF RESEARCH AND DEVELOPMENT” (Nondefense) “In Billions of Constant (FY 2017) Dollars” average yearly spending = $62.162 BILLION FY 2010-17 “SUMMARY OF OUTLAYS FOR THE CONDUCT OF RESEARCH AND DEVELOPMENT” (Nondefense) “In Billions of Constant (FY 2017) Dollars” average yearly spending = $65.387 BILLION ($65,387,000,000) FY 2018-23 “SUMMARY OF OUTLAYS FOR THE CONDUCT OF RESEARCH AND DEVELOPMENT” (Nondefense) “In Billions of Constant (FY 2017) Dollars” average yearly spending = $66.133 BILLION Does that look like any cutting is being done? If you listen to the shrieking #science zombies, there’s cuts being made, there’s always cuts being made & there’s always a crisis. That’s how they keep this gravy train rolling & they want the taxpayer to continue handing them a pile of money that they can then waste on frivolous ventures because the troglodytes at NIH know better & you’re just a pleb. Now let’s evaluate that inflation-adjusted spending (Table 9.7) on a per capita basis, shall we? FY 2000-23 “SUMMARY OF OUTLAYS FOR THE CONDUCT OF RESEARCH AND DEVELOPMENT” (Nondefense) “In Billions of Constant (FY 2017) Dollars” average yearly spending per capita ($1,491,900,000,000 spending & 7,473,134,960 population) =$199.63 FY 2010-17 “SUMMARY OF OUTLAYS FOR THE CONDUCT OF RESEARCH AND DEVELOPMENT” (Nondefense) “In Billions of Constant (FY 2017) Dollars” average yearly spending per capita ($523,100,000,000 spending & 2,536,990,138 population) = $206.18 FY 2018-23 “SUMMARY OF OUTLAYS FOR THE CONDUCT OF RESEARCH AND DEVELOPMENT” (Nondefense) “In Billions of Constant (FY 2017) Dollars” average yearly spending per capita (1,986,627,255 population & $396,800,000,000 spending) = $199.73 It fell a bit per capita in that last time frame, NIH has been so cheated & mistreated. However, the last time frame is pinch higher than the FY 2000-23 average. You owe NIH a $200 check, pay up. You also Medicaid a large check, you owe the Fed. Dept of “Education” a check, & HUD, Dept. of Energy, foreign aid subsidies, agricultural subsidies, the Dept. of Food Stamps, I mean Agriculture – you see how that all adds up. There’s a bevy of “it’s only 1% of all federal spending” programs & here we are, $35 TRILLION in the hole. Let’s look at NIH spending (and unfortunately, not inflation-adjusted) itself & see the trends there. https://www.downsizinggovernment.org/charts/ https://archive.is/6TtCH https://www.downsizinggovernment.org/health-and-human-services According to Cato, NIH spending adjusted for inflation has spiked massively since the 1970s & 1980s. Unfortunately, their graph stops at FY 2019. If you download https://officeofbudget.od.nih.gov/pdfs/FY25/spending_hist/Mechanism Detail for Total NIH FY 2000 - FY 2023 (V).pdf https://report.nih.gov/nihdatabook/report/226 you’ll get some good information. From FY 2001-03, average yearly NIH funding in toto was $23,480,397,667. From FY 2021-23 that yearly average was $45,479,029,333. For those of you keeping score at home (and I used 3 FY’s two decades apart, so I am not cherry-picking) that’s a nominal increase of >93.5%! Yet, you will hear these clowns screech about #science & their “funding being cut.” Donald Trump & his Congress might oversee the first substantial cut in your funding due to profligate spending that has been taking place for eons. Your unaccountable gravy train is over! Average yearly in toto NIH funding FY 2011-13 = $30,187,177,667. Look like any cuts are happening? From FY 2001-2003, total Research Project Grants (subtotal, RPGs) yearly average = $12,973,607,333. FY 2011-2013 yearly average = $16,173,435,000 & FY 2021-23 = $25,374,170,667 (95.5% higher in nominal terms than FY 2001-03). You will still hear them whine about cuts. There’s always a #science crisis & humanity is on the cusp of destruction because of this. Reminds me of the shrieking during the TARP bailouts in 2008. “If we don’t do this, the Apocalypse will happen.” These people are lying to you! Let us now turn to Table 12.1 in the OMB Historical data & tally “Table 12.1 - SUMMARY COMPARISON OF TOTAL OUTLAYS FOR GRANTS TO STATE AND LOCAL GOVERNMENTS”. I’ll start with “As Percentages of Federal Outlays” & this includes “Capital Investment” & “Payment for Individuals.” FY 1970-2023 “Summary Comparison of Total Outlays for Grants to State & Local Governments” as a % of all federal outlays = 15.083% FY 2000-2023 “Summary Comparison of Total Outlays for Grants to State & Local Governments” as a % of all federal outlays = 16.712% FY 2010-17 “Summary Comparison of Total Outlays for Grants to State & Local Governments” as a % of all federal outlays = 16.637% FY 2018-23 “Summary Comparison of Total Outlays for Grants to State & Local Governments” as a % of all federal outlays = 16.816% Stay at the same table & we’ll tally this spending per capita from various time frames. FY 2000-23 “Summary Comparison of Total Outlays for Grants to State & Local Governments” (In Billions of Constant (FY 2017) Dollars (7,473,134,960 population & $15,444,100,000,000 spending) = $2,066.61 per capita. FY 2010-17 “Summary Comparison of Total Outlays for Grants to State & Local Governments” (In Billions of Constant (FY 2017) Dollars (2,536,990,138 population & $5,072,700,000,000 spending) = $1,999.49 per capita. FY 2018-23 Summary Comparison of Total Outlays for Grants to State & Local Governments” (In Billions of Constant (FY 2017) Dollars (1,986,627,255 population & $5,199,700,000,000 spending) = $2,617.35 per capita. There is no cutting going on, not even close! These people are lying & they won’t care until the dollar collapses & the shelves empty. Then they’ll be screeching that the government owes them a meal, but they might as well be hoping for manna from heaven. If you go to the first two links I provided at the very top of the page (I’m not going to reproduce them here, save a short synopsis) you’ll find some NIH waste such as: Studying people’s rejection threshold for spice & bitterness, federal funding for research has been increasing at massive rates for over half a century, telling young adults to eat more fruits and vegetables, why mother’s love their dogs as much as kids, giving truckers tips to lose weight & motivational phone calls, billions of dollars on “alternative medicine”, smartphone apps aimed to getting cannabis users to exercise, post-incarceration health care for “trans” women, promoting safe sex in South Africa, helping homosexuals quit smoking, understand how sexual risk behaviors among homosexual men may be facilitated by the nature of GPS-enabled smartphone applications, studying the effects of sex-selective abortions in India & the list goes on. Read them all if you want. Don’t forget, the NIH was at the forefront of pushing these garbage-can COVID-19 “vaccines” https://www.nih.gov/news-events/nih-research-matters/experimental-coronavirus-vaccine-safe-produces-immune-response https://pmc.ncbi.nlm.nih.gov/articles/PMC9734065/ that were not only not effective at preventing transmission, but I believe they killed a lot of working-age people. https://rumble.com/playlists/TRwipQjtxfk *That doesn’t mean it wasn’t a worthy gamble for a person aged 60+ who has immunodeficiencies. However, anyone who is “in good health” should’ve taken a hard pass on them* I’ll close w/ some salient comments from a few people over at the Cato Institute on the efficacy of “government research.” Pertaining to research funded by the taxpayers, it’s a lot like paying for one’s own education. If you have some skin in the game, you’re more likely to work harder & take it more seriously. If you’re being handed a pile of money, you’re more likely to shirk your duties because you have an (hypothetically) endless stream of money coming from taxpayers. NIH/HHS has succumbed to this, they’ve been getting piles of money (and Congress has abdicated their duties as taxpayer watchdog) for so long, the right hand doesn’t know what the left hand is doing & here we are. IT ENDS NOW! What if Washington & the NIH were able to raise the average life expectancy to 90, as well as eradicate Alzheimer's & Parkinson’s, but it cost so much the dollar collapsed & the grocery store shelves were empty? Worth it? Can we all live to 100 if the national debt triples? No sane person would say, “yes.” Perhaps the people who depend on NIH funding might say yes until they waddle their fat ass down to Starbucks & there are no egg sandwiches or anything else. America is four missed meals away from chaos. https://www.cato.org/blog/dont-we-really-need-government-research To take the Internet as proof that the government is a necessary producer of research and innovation, you have to reject the scientific method. Unfortunately, there are rarely controls in public policy. We can’t find out what would have happened if government policy had taken a different course, so we don’t know anything more about who should fund research from the fact that government-funded research has produced good things in the past. But what would have happened if U.S. public policy had taken a different course? I’ve thought about the impossible-to-answer question of where we would have been without DARPA and other government influences on telecom. What most people don’t consider, I believe, is the restraining influence the government-granted AT&T monopoly had on telecommunications for most of the 20th century. AT&T developed a “Teletypewriter Exchange” system in 1931, for example, but had no need to develop it, there being little or no competitive pressure to do so. (Its patent on attaching devices to phone wires undoubtedly helped as well, preventing anyone using AT&T’s wires for modem service.) Had there been competition, I suspect that someone would have come up with the idea of packet-switched networks—that’s what the Internet is—before Leonard Kleinrock did in 1962. Kleinrock was a student at MIT—he wasn’t at DARPA, which didn’t get into packet-switching until about 1966. (Then again, MIT was almost certainly awash in government money—specifically military money—so there you go. Maybe we owe all the good things we’ve got to war, but I doubt it.) My guess—and it’s only that—is that we would have had the Internet some decades earlier if not for government interventions in telecommunications. We probably would have had multiple, competing “Internets,” actually, adopted more slowly than the Internet we got. (In a chapter of Privacy in America: Interdisciplinary Perspectives, I explored how government has accelerated the development of computing and communications, overpowering society’s capacity to adjust, with negative consequences for privacy.) Support for government-funded research requires one to elide opportunity costs, the things foregone when one thing is chosen. As I said before, tradeoffs are ineluctable: Money spent on government research takes away from private research, or from other priorities such as reducing debt. In the absence of taxation to support research, the money would go to the public’s priorities as determined directly by the public in manifold spending and investing decision. Taxation and spending on government research is merely the substitution of centralized, political decision-making for a distributed, direct decision-making system. Its supporters are generally going to be beneficiaries of that system—elites, in short. Even these beneficiaries of the status quo tend to agree that political decisions about funding for scientific research are warped. The solution to that problem, they’ll say, is fixing the political system—that is, creating a political system that is not so political. And: https://www.cato.org/blog/subsidizing-research-technology Technology expert Jeffrey Funk has a great article on innovation in American Affairs. He critiques venture capital markets and current U.S. research funding. I am not on board with some of Funk’s ideas, but he nicely summarizes the bureaucratic distortions of government-funded research that policymakers should consider before increasing subsidies further. University engineering and science programs are also failing us because they are not creating the breakthrough technologies that America and its start-ups need. … This decline in technological breakthroughs cannot be attributed to a lack of funding: governments have been funding university research for more than half a century, yet research productivity has declined overall, including research into semiconductors, agriculture, and pharmaceuticals. Other than the internet being commercialized in the 1990s—the technological foundations of which were created in the 1960s and 1970s—few new science-based technologies have emerged in the last thirty years. And the small number of successes were mostly achieved by foreign competitors: lithium-ion batteries, OLEDs, and solar cells, for instance, were commercialized by Japanese, Korean, and Chinese companies. Even Nobel Prize–winning research seems to lead to fewer technological breakthroughs than in the past, according to a survey of top scientists. … Furthermore, looking at some of these prizes in more detail reveals that much of the research work was done at corporate and not university labs. For instance, among Nobel Prizes for physics and chemistry awarded since 2000 in lithium-ion batteries, LEDs, charge-coupled devices, lasers, integrated circuits, and optical fiber, nine of the seventeen recipients did their work at corporate labs. The only high-impact award that solely involved university research was graphene. Many scientists point to the nature of the contemporary university research system, which began to emerge over half a century ago, as the problem. They argue that the major breakthroughs of the early and mid-twentieth century, such as the discovery of the DNA double helix, are no longer possible in today’s bureaucratic, grant-writing, administration-burdened university. The idea of scientists following their hunches to find better explanations and thus better products and services has yielded to the reality of huge labs pursuing grants to keep staff employed. Young scientists have become mere cogs in a grant-seeking machine, forced to suppress their curiosity and do what they are told by senior colleagues who are overwhelmed by administrative work. Two-author papers, like the one describing the structure of DNA, have been replaced by hundred-author papers. Scientific merit is measured by citation counts and not by ideas or by the products and services that come from those ideas. Thus, labs must push papers through their research factories to secure funding, and issues of scientific curiosity, downstream products and services, and beneficial contributions to society are lost. Nobel laureates have similar criticisms of the contemporary culture of academic research. Various laureates in biochemistry, biology, computer science, and physics have claimed that they would now be denied funding for their prizewinning research because of grant-issuing bodies’ preference for less risky projects; one physicist even claims he could not get a job today. In today’s climate every project must succeed, and thus our scientists study only marginal, incremental topics where the path forward is clear and a positive result is virtually guaranteed. … One option is to recreate the system that existed prior to the 1970s, when most basic research was done by companies rather than universities. This was the system that gave us transistors, lasers, LEDs, magnetic storage, nuclear power, radar, jet engines, and polymers during the 1940s and 1950s. Apart from these past successes, there are a number of structural reasons why conducting basic research at corporate labs is likely to produce more useful results than in universities. First, corporate scientists are focused more on solving problems, whereas scientists in universities must also take on the administrative work of writing papers—often in collaboration with dozens of coauthors—managing PhD students and postdocs, reading dissertations and draft papers, writing letters of recommendation, and filing grant proposals to keep themselves, their students, and their staff employed. Unlike their predecessors at Bell Labs, IBM, GE, Motorola, DuPont, and Monsanto seventy years ago, top university scientists are more administrators than scientists now—one of the greatest misuses of talent the world has ever seen. Corporate labs have smaller administrative workloads because funding and promotion depend on informal discussions among scientists and not extensive paperwork. Second, the informal discussions and collaboration characteristic of corporate labs allows the scientists who work there to make better decisions about both the merits of different designs in the short term and problem-solving approaches for the long term. These informal discussions can also focus on issues of cost and performance: how to measure them and how to improve the technologies along these metrics. Such discussions rarely occur in universities because their goal is the publication of research rather than the development of new products and services. Third, conducting basic research at corporate laboratories can help avoid the problem of hyper-specialization in academia. Because publications are the key output of university professors, there has been a growing number of journals over the last fifty years to accommodate the growing number of university scientists, and these journals have become increasingly specialized. For example, Nature now publishes more than 144 journals and the Institute of Electrical and Electronic Engineers more than 200. This growing specialization turns professors into narrowly focused researchers unable to understand not only the needs of the marketplace but also the metrics of cost and performance for a new technology, which should dictate long-term goals. Relocating more basic research to corporate labs can reduce this specialization by placing scientists in an organization whose goal is to commercialize new technologies. And lastly: https://www.cato.org/blog/governments-should-not-fund-research https://ncses.nsf.gov/pubs/nsf23320 In fiscal year 2022, the federal government spent $76 billion subsidizing nondefense, scientific research. This component of federal expenditure is modest relative to the $6.27 trillion total or the $632.7 billion private sources spent on research and development in 2021. It nevertheless merits scrutiny… Private charity also funds basic research. The American Cancer Society, 100 years old this year, collects personal donations and invested more than $145 million in cancer research in 2022, and more than $5 billion since 1946. Its history suggests that private charities are willing to invest in research that government might avoid. When the ACS was founded, it was taboo to even discuss cancer in public. Private charities fund numerous areas of research. The Howard Hughes Medical Institute funds about $660 million in medical research per year, and countless charities focus on specific diseases (the Alzheimer’s Association, $90 million in 2022; the Parkinson’s Foundation, $24.9 million). The Bill & Melinda Gates Foundation distributed $3.6 billion in 2021 for global health research and development. Additional examples include the Alfred P. Sloan Foundation (economics, energy, the environment, and physics; $48.1 million in 2022), the Andrew W. Mellon Foundation (arts and humanities; $592 million), and the Ford Foundation (drivers of socioeconomic and political inequality; $713 million). Moreover, much innovation does not rest directly on basic research: Microsoft Windows, TurboTax, and the iPhone did not spawn from some grand theory but instead grew from ongoing trial-and-error processes in response to pressing needs. Regardless of these issues, the long-term record suggests little impact of federal research funding on the U.S. economy. The graph below plots real GDP per capita since 1870 along with federal nondefense research and development spending since 1949, when the government began reporting this statistic. Funding existed prior to 1949 but was small and embedded in other parts of the budget; in 1940, it was under $105 million (in 2012 dollars). The growth of GDP per capita seems unaffected even as research funding rose dramatically following World War II. The average annualized growth rate of real GDP per capita was 1.96 percent between 1870–1948 and 2 percent between 1949–2022. Thus, the standard model likely overstates the need for government funding to generate innovation. In addition, government funding generates substantial costs beyond its monetary expenditure. If government funds research, it must decide which projects to fund, allowing political forces to influence the choice. President George W. Bush limited federal funding for stem cell research that used human embryos in response to pressure from anti-abortion forces. The recent affirmative action case against Harvard is a legal issue because Harvard accepts federal research funding. The National Institute on Drug Abuse has been criticized for displaying bias in favor of drug prohibition. Another concern is that a central source of funding may limit which projects can access funds, reducing research variety. Special interest groups can successfully lobby for funding that supports their research even if it is not the most deserving. Indeed, private research funding is distributed more widely: between 2010 and 2019, 200 organizations received 80 percent of National Institutes of Health (NIH) and National Science Foundation (NSF) grants, whereas the top 200 recipients of private funding received only 33 percent of donations. Scientists have explained how private funding has enabled them to explore new ideas, adjust budgets, and avoid lengthy bureaucratic approval processes. Finally, much government funding goes toward applied, not basic, research. In FY 2022, 38 percent of nondefense federal R&D funds were earmarked for applied research. This piece cannot be justified on the grounds that private actors will systematically undersupply it due to a lack of monetary incentive. {X} I guess if we spent a few hundred billion dollars more every year, suddenly all these kids that can barely read, will suddenly be able to read? Will the perpetual test score gap between Asians & Blacks or Whites & Blacks suddenly evaporate? https://rumble.com/v52f3kv-creepy-old-man-sam-seder-hates-charter-schools-part-i.html https://rumble.com/v52fjnm-creepy-old-man-sam-seder-hates-charter-schools-part-ii.html https://rumble.com/v52fp43-creepy-old-man-sam-seder-hates-charter-schools-part-iii.html The Federal Department of Education is unconstitutional & ineffective, to boot https://www.youtube.com/watch?v=vsTPvxHKjPw {Y} https://wamu.org/story/12/06/08/from_tim_to_sarah_au_student_body_president_unveils_big_news/ This is hilarious! Tim McBride says, “McBride said [he] was wasting [his] life pretending to be someone [he] wasn’t. So on Christmas Day [he] came out to [his] family, and later shared [his] secret with close friends and teachers.” #science https://rumble.com/playlists/dMJZl8ovgts What the heck? Tim, you are currently continuing this masquerade, trying to make folks believe you are an XX chromosome homo sapien, when you are not. You are delusional, my friend. If you want to dress like a girl (and why do these folks usually have to dress like the opposite gender, as if there are differences in the way each gender dresses, odd, huh? Why not say, “I’m a girl” & dress like Donald Trump going to a board meeting) go ahead, I don’t care. However, when you demand I join you in that delusion & *ATTEMPT* to enter my daughter’s locker room, you & I have a problem little man. You’ll get arrested if you try this in Iowa. Mr. Chairman, I Yield Back!165 views 4 comments -
Tell your Democrat friends: Take the Bernie Sanders Tax Hike Challenge
UTubekookdetectorHere is the gist in a nutshell: I give you Exhibit A: From FY 1954 (Ike's 1st)-FY 1981 (Carter's last) the top personal income tax rate was >70%, the avg. capital gains rate (long-term) ~29%, the corporate income tax rate was always sky-high (and often the income level where the top rate was hit, didn't change for years--couple that w/ runaway inflation & you have bracket creep) & payroll taxes went up >350% from 1950-75. The results? The budget was balanced a grant total of 3 times (2 times under Ike & in FY 1969), despite these ridiculously high tax rates. Point being, Bernie et al have no intention of balancing the budget, they just want more income redistribution--they WILL NOT balance the budget. Ever. Exhibit B (this is even more important as Democrats controlled Congress the entire time): From FY 1962 (Kennedy's 1st)-FY 1981 (Carter's last) the top personal income tax rate was >70%, the avg. capital gains (long-term) rate was 30.5% (this is double-taxation at its finest), the corporate income tax rate https://taxfoundation.org/federal-corporate-income-tax-rates-income-years-1909-2012 remained high & payroll taxes increased >350% from 1950-75. The results? In FY 1969 the budget was balanced.... one solitary time. Meaning: Bernie Sanders et al. have no intention of balancing the budget, they will not balance the budget, they just want more income redistribution. What say ye Dumbasscrats. ED. NOTE: See here https://www.youtube.com/watch?v=WQYA2r7pxVg & here https://www.youtube.com/watch?v=-wWmcK47q6M (4:50-end) for plenty of details & data, pertaining to this challenge. Even under a very high-tax time-frame, Washington managed to balance the budget a single, solitary time. Keep in mind, this was before Social Security & Medicare really started going off the rails. The labor force participation rate was much higher than in recent decades, out-of-wedlock births & fragmented families were much less common on the 1950s & 1960s than in recent decades too. Yet, the budget was balanced a single, solitary time. In addition, back in the 1950s-1970s every single income quintile had a net positive personal income tax rate overall. Today, even before the COVID-19 spendathon, the bottom two quintiles had negative personal income tax rates, they don't contribute. Granted, there are some folks & families in those quintiles that do have positive personal income tax rates, but overall they do not. I am certainly all for poor people (we could have a flat personal income tax or head tax & see how much support that gets in Congress) not paying taxes, but squealing like lunatics over "the rich" is disingenuous. If anyone else wants to take the Bernie Sanders Tax Hike Challenge—don’t sing it, bring it! *** The relevant links The Bernie Sanders Tax Hike Challenge (archived versions just in case you refuse to log into Facebook) https://archive.ph/bbjKd https://web.archive.org/web/20200114043052/https://www.facebook.com/notes/old-fart-rants-debunked/old-fart-rants-takes-the-bernie-sanders-tax-hike-challenge/2058315051071567/ Live version https://www.facebook.com/notes/old-fart-rants-debunked/old-fart-rants-takes-the-bernie-sanders-tax-hike-challenge/2058315051071567/ Screenshots from when Old Fart Rants took the Bernie Sanders Tax Hike Challenge & was defeated soundly https://www.facebook.com/media/set/?set=a.2058314824404923 https://web.archive.org/web/20221004000957/https://www.facebook.com/media/set/?set=a.2058314824404923 https://archive.ph/UJPDs More reading: Debunking the Democrat talking point that we must raise taxes on successful people to balance the budget & pay for all this stuff. It’s never been about tax rates, the problem has always been spending & pols in Washington will do what pols in Washington do – they will spend gobs of money on X, Y & Z regardless if the money for that is set aside or not http://freewebs.com/professor_enigma/sam-seder-aoc-tax-the-rich My essay debunking the senile lunatic Bernie Sanders http://freewebs.com/professor_enigma/bernie-sanders322 views -
So, You're Nostalgic for the 1950s?
UTubekookdetectorOut-of-wedlock birth rate https://www.youtube.com/watch?v=p5pWdKMB4mE (11:05-15:39 see also links under “Out-of-wedlock births”) Federal Spending Per Capita, adjusted for inflation https://www.youtube.com/watch?v=Usc42LN3w4E National Debt, Federal Debt Per Capita, adjusted for inflation https://www.youtube.com/watch?v=aUjiuu5-4-A Individual Transfer Payments (inflation-adjusted dollars & as a % of all federal outlays) https://www.whitehouse.gov/omb/budget/Historicals/ (Table 11.1) Federal Spending; Mandatory Spending as a % of all federal outlays https://www.whitehouse.gov/omb/budget/Historicals/ (Tables 8.2 & 8.6) Means-tested entitlements as a % of all federal spending https://www.whitehouse.gov/omb/budget/Historicals/ (Table 8.2) https://www.whitehouse.gov/sites/default/files/omb/budget/fy2016/assets/hist_intro.pdf Labor Force Participation Rate https://www.youtube.com/watch?v=no9Rwi6CNuI (7:49-11:38) http://data.bls.gov/timeseries/LNS11300061 http://beta.bls.gov/dataViewer/view/timeseries/LNS11300164Q The rich didn’t pay those astronomical personal income tax rates of the 1950s https://fullerfiles.wordpress.com/2014/08/01/debunking-the-liberal-logic-on-taxes-in-the-1950s/ http://beingclassicallyliberal.liberty.me/2014/05/27/no-we-never-had-over-70-tax-rates-on-the-rich/ http://www.cbo.gov/sites/default/files/cbofiles/ftpdocs/98xx/doc9884/12-23-effectivetaxrates_letter.pdf http://www.fas.org/sgp/crs/misc/R42111.pdf http://www.irs.gov/uac/SOI-Tax-Stats-Individual-Statistical-Tables-by-Tax-Rate-and-Income-Percentile#_grp1 http://www.irs.gov/pub/irs-soi/51-86inintxshatr.pdf Homeownership rate data/HUD Spending http://www.census.gov/housing/hvs/data/histtabs.html http://www.census.gov/housing/hvs/data/histtab14.xls http://research.stlouisfed.org/fred2/series/USHOWN/ http://www.census.gov/hhes/www/housing/census/historic/owner.html http://www.downsizinggovernment.org/charts/ Federal Receipts by source, % of https://www.whitehouse.gov/omb/budget/Historicals/ (Table 2.2) Federal Personal Income Tax Rates, Federal Corporate Income Tax Rates & FICA/HI (Social Security & Medicare) Tax Rates http://taxfoundation.org/article/social-security-and-medicare-tax-rates-calendar-years-1937-2009 http://taxfoundation.org/article/federal-corporate-income-tax-rates-income-years-1909-2012 http://taxfoundation.org/article/us-federal-individual-income-tax-rates-history-1913-2013-nominal-and-inflation-adjusted-brackets 1) Out of wedlock birth rate 2) Federal Debt Per Capita 3) Federal Spending Per Capita 4) Federal Transfer Payments to Individuals 5) Means-Tested Spending 6) So-called Mandatory Spending 7) Labor Force Participation Rates 8) Homeownership Data 9) Sources of Federal Tax Revenue 10) Personal Income Tax Rates (taking a special look at years where those rates were changed) 11) Various Personal Income Tax Data (dispelling certain Progressive myths concerning personal income tax rates of the 1950s)91 views -
So you’re Nostalgic for the 1950s? Part II
UTubekookdetectorFood Stamp enrollment http://www.fns.usda.gov/pd/supplemental-nutrition-assistance-program-snap http://www.fns.usda.gov/sites/default/files/pd/SNAPsummary.pdf US population data http://www.census.gov/prod/2002pubs/pol02marv.pdf (Appendix A) http://www.census.gov/quickfacts/table/PST045215/00 http://www.census.gov/population/estimates/nation/popclockest.txt https://web.archive.org/web/*/http://quickfacts.census.gov/qfd/states/00000.html Federal Spending Data https://www.whitehouse.gov/sites/default/files/omb/budget/fy2017/assets/hist.pdf (Tables 8.2 & 8.8) Jobs data (I went with this over BLS data because BEA was using an FTE-equivalent basis, I thought that was the best evaluation. BEA & BLS data would’ve been an apples-to-oranges comparison) http://www.bea.gov/iTable/iTable.cfm?ReqID=9&step=1#reqid=9&step=1&isuri=135 views -
Senator Rand Paul raises the alarm on our coming fiscal calamity
UTubekookdetectorSenate votes to “Waive All Applicable Budgetary Discipline” [X] indicates vote to waive was successful. Under the vote I will include the # of Republicans (e.g. 23 of 50 R) & Democrats (e.g. 33 of 50 D) that voted to “Waive All Applicable Budgetary Discipline”. 117th Congress - 2nd Session (2022) https://www.senate.gov/legislative/LIS/roll_call_votes/vote1172/vote_117_2_00408.htm [X] 16 of 50 R – 49 of 50 D https://www.senate.gov/legislative/LIS/roll_call_votes/vote1172/vote_117_2_00314.htm 7 of 50 R – 50 of 50 D https://www.senate.gov/legislative/LIS/roll_call_votes/vote1172/vote_117_2_00311.htm 50 of 50 R – 4 of 50 D https://www.senate.gov/legislative/LIS/roll_call_votes/vote1172/vote_117_2_00310.htm 1 of 50 R – 4 of 50 D https://www.senate.gov/legislative/LIS/roll_call_votes/vote1172/vote_117_2_00300.htm 49 of 50 R – 0 of 50 D https://www.senate.gov/legislative/LIS/roll_call_votes/vote1172/vote_117_2_00290.htm 50 of 50 R- 5 of 50 D https://www.senate.gov/legislative/LIS/roll_call_votes/vote1172/vote_117_2_00288.htm 0 of 50 R – 1 of 50 D https://www.senate.gov/legislative/LIS/roll_call_votes/vote1172/vote_117_2_00270.htm [X] 17 of 50 R – 47 of 50 D 117th Congress - 1st Session (2021) https://www.senate.gov/legislative/LIS/roll_call_votes/vote1171/vote_117_1_00311.htm [X] 14 of 50 R – 50 of 50 D https://www.senate.gov/legislative/LIS/roll_call_votes/vote1171/vote_117_1_00286.htm [X] 22 of 50 R – 50 of 50 D https://www.senate.gov/legislative/LIS/roll_call_votes/vote1171/vote_117_1_00224.htm [X] 23 of 50 R – 49 of 50 D https://www.senate.gov/legislative/LIS/roll_call_votes/vote1171/vote_117_1_00139.htm [X] 14 of 50 R – 50 of 50 D https://www.senate.gov/legislative/LIS/roll_call_votes/vote1171/vote_117_1_00097.htm 48 of 50 R – 1 of 50 D (should biological men be competing w/ biological women in sports?) https://www.senate.gov/legislative/LIS/roll_call_votes/vote1171/vote_117_1_00094.htm 49 of 50 R - 3 of 50 D https://www.senate.gov/legislative/LIS/roll_call_votes/vote1171/vote_117_1_00083.htm 49 of 50 R - 2 of 50 D https://www.senate.gov/legislative/LIS/roll_call_votes/vote1171/vote_117_1_00077.htm 48 of 50 R – 0 of 50 D https://www.senate.gov/legislative/LIS/roll_call_votes/vote1171/vote_117_1_00074.htm 0 of 50 R - 42 of 50 D https://www.senate.gov/legislative/LIS/roll_call_votes/vote1171/vote_117_1_00050.htm 50 of 50 R - 1 of 50 D https://www.senate.gov/legislative/LIS/roll_call_votes/vote1171/vote_117_1_00041.htm 40 of 50 R – 0 of 50 D (no more employment-based visas until the labor force reaches pre-plandemic levels) https://www.senate.gov/legislative/LIS/roll_call_votes/vote1171/vote_117_1_00037.htm 50 of 50 R – 0 of 50 D https://www.senate.gov/legislative/LIS/roll_call_votes/vote1171/vote_117_1_00036.htm 50 of 50 R – 0 of 50 D (contra stacking the SCOTUS) https://www.senate.gov/legislative/LIS/roll_call_votes/vote1171/vote_117_1_00029.htm 49 of 50 R – 0 of 50 D https://www.senate.gov/legislative/LIS/roll_call_votes/vote1171/vote_117_1_00025.htm 50 of 50 R – 2 of 50 D (To establish a deficit-neutral reserve fund relating to prioritizing taking into custody aliens charged with a crime resulting in death or serious bodily injury) https://www.senate.gov/legislative/LIS/roll_call_votes/vote1171/vote_117_1_00024.htm 50 of 50 R – 0 of 50 D https://www.senate.gov/legislative/LIS/roll_call_votes/vote1171/vote_117_1_00023.htm 50 of 50 R – 2 of 50 D (To establish a deficit-neutral reserve fund relating to improving health care to prohibit a health care practitioner from failing to exercise the proper degree of care in the case of a child who survives an abortion or attempted abortion) 25 attempts in the 117th Congress to “Waive All Budgetary Discipline”, flip the bird to actual taxpayers & 6 succeeded. Democrats want to end the filibuster because it is one of the reasons we are able to stop a lot of horrendous spending from becoming law. Sans the filibuster, it would be easier for public sector goons who never had a real job (e.g., Bernie Sanders) in the private sector to spend us into a financial apocalypse. Democrats also want to end the Filibuster & neuter precedents like https://crsreports.congress.gov/product/pdf/RL/RL30862 https://www.heritage.org/budget-and-spending/report/consequential-decisions-reconciliation-and-the-byrd-rule The Byrd Rule https://www.conservapedia.com/Byrd_rule so they can use the reconciliation process to tack on garbage that is not germane (e.g. attaching a minimum wage hike or card check to a bill dedicated to education or defense spending) & do that with 50 votes. The overweight Kamala Harris or some troglodyte like her would cast the tie-breaking vote. The filibuster & the roadblocks tied to it https://crsreports.congress.gov/product/pdf/RL/97-865 serve a purpose. Can you imagine how crazy these lunatics would get w/ your money if they could spindle & mutilate budgetary discipline & abuse the reconciliation process w/ 50 votes? There’s a lot of really bad legislation that gets through, but some is stopped because folks like Rand Paul demand that spending on X have an offset. https://www.heritage.org/budget-and-spending/commentary/congress-guts-budget-rules-and-misses-chance-cut-spending This requires 60 votes & all too often there are 60 people in the Senate who are not thinking of your grandchildren when they vote “yea.” Now, back to the game. 116th Congress - 2nd Session (2020) https://www.senate.gov/legislative/LIS/roll_call_votes/vote1162/vote_116_2_00013.htm [X] 31 of 53 R – 47 of 47 D https://www.senate.gov/legislative/LIS/roll_call_votes/vote1162/vote_116_2_00118.htm [X] 22 of 53 R – 46 of 47 D 116th Congress - 1st Session (2019) https://www.senate.gov/legislative/LIS/roll_call_votes/vote1161/vote_116_1_00414.htm [X] 26 of 53 R – 38 of 47 D https://www.senate.gov/legislative/LIS/roll_call_votes/vote1161/vote_116_1_00399.htm [X] 43 of 53 R – 39 of 47 D https://www.senate.gov/legislative/LIS/roll_call_votes/vote1161/vote_116_1_00128.htm [X] 38 of 53 R – 46 of 47 D 5 for 5 in the 116th Congress 115th Congress - 2nd Session (2018) https://www.senate.gov/legislative/LIS/roll_call_votes/vote1152/vote_115_2_00192.htm [X] 22 of 51 R – 46 of 49 D (this one was a budget buster deluxe) https://www.senate.gov/legislative/LIS/roll_call_votes/vote1152/vote_115_2_00059.htm 0 of 51 R - 21 of 49 D https://www.senate.gov/legislative/LIS/roll_call_votes/vote1152/vote_115_2_00053.htm [X] 50 of 51 R - 17 of 49 D 15th Congress - 1st Session (2017) https://www.senate.gov/legislative/LIS/roll_call_votes/vote1151/vote_115_1_00324.htm [X] 43 of 52 R – 48 of 48 D https://www.senate.gov/legislative/LIS/roll_call_votes/vote1151/vote_115_1_00322.htm 51 of 52 R – 0 of 48 D https://www.senate.gov/legislative/LIS/roll_call_votes/vote1151/vote_115_1_00247.htm [X] 33 of 52 R – 48 of 48 D https://www.senate.gov/legislative/LIS/roll_call_votes/vote1151/vote_115_1_00174.htm 50 of 52 R – 0 of 48 D https://www.senate.gov/legislative/LIS/roll_call_votes/vote1151/vote_115_1_00172.htm 10 of 52 R – 0 of 48 D https://www.senate.gov/legislative/LIS/roll_call_votes/vote1151/vote_115_1_00168.htm 43 of 52 R – 0 of 48 D https://www.senate.gov/legislative/LIS/roll_call_votes/vote1151/vote_115_1_00024.htm 51 of 52 R – 1 of 48 D https://www.senate.gov/legislative/LIS/roll_call_votes/vote1151/vote_115_1_00022.htm 51 of 52 R – 1 of 48 D https://www.senate.gov/legislative/LIS/roll_call_votes/vote1151/vote_115_1_00019.htm 49 of 52 R – 0 of 48 D https://www.senate.gov/legislative/LIS/roll_call_votes/vote1151/vote_115_1_00018.htm 1 of 52 R – 47 of 48 D https://www.senate.gov/legislative/LIS/roll_call_votes/vote1151/vote_115_1_00017.htm 51 of 52 R – 0 of 48 D https://www.senate.gov/legislative/LIS/roll_call_votes/vote1151/vote_115_1_00016.htm 47 of 52 R – 0 of 48 D https://www.senate.gov/legislative/LIS/roll_call_votes/vote1151/vote_115_1_00013.htm 50 of 52 R – 0 of 48 D https://www.senate.gov/legislative/LIS/roll_call_votes/vote1151/vote_115_1_00011.htm 51 of 52 R – 0 of 48 D https://www.senate.gov/legislative/LIS/roll_call_votes/vote1151/vote_115_1_00009.htm 51 of 52 R – 0 of 48 D https://www.senate.gov/legislative/LIS/roll_call_votes/vote1151/vote_115_1_00008.htm 1 of 52 R – 47 of 48 D https://www.senate.gov/legislative/LIS/roll_call_votes/vote1151/vote_115_1_00007.htm 0 of 52 R - 47 of 48 D https://www.senate.gov/legislative/LIS/roll_call_votes/vote1151/vote_115_1_00006.htm 1 of 52 R – 48 of 48 D https://www.senate.gov/legislative/LIS/roll_call_votes/vote1151/vote_115_1_00005.htm 31 of 52 R – 0 of 48 D 4 for 22 in the 115th Congress *** 114th Congress - 2nd Session (2016) https://www.senate.gov/legislative/LIS/roll_call_votes/vote1142/vote_114_2_00139.htm [X] 40 of 54 R – 45 of 46 D https://www.senate.gov/legislative/LIS/roll_call_votes/vote1142/vote_114_2_00115.htm [X] 53 of 54 R – 32 of 46 D https://www.senate.gov/legislative/LIS/roll_call_votes/vote1142/vote_114_2_00079.htm [X] 40 of 54 R – 44 of 46 D https://www.senate.gov/legislative/LIS/roll_call_votes/vote1142/vote_114_2_00076.htm [X] 25 of 54 R – 45 of 46 D https://www.senate.gov/legislative/LIS/roll_call_votes/vote1142/vote_114_2_00053.htm 33 of 54 R – 0 of 46 D https://www.senate.gov/legislative/LIS/roll_call_votes/vote1142/vote_114_2_00030.htm 5 of 54 R – 43 of 46 D https://www.senate.gov/legislative/LIS/roll_call_votes/vote1142/vote_114_2_00029.htm 2 of 54 R – 44 of 46 D 114th Congress - 1st Session (2015) https://www.senate.gov/legislative/LIS/roll_call_votes/vote1141/vote_114_1_00338.htm [X] 37 of 54 R – 36 of 46 D https://www.senate.gov/legislative/LIS/roll_call_votes/vote1141/vote_114_1_00328.htm 1 of 54 R – 45 of 46 D https://www.senate.gov/legislative/LIS/roll_call_votes/vote1141/vote_114_1_00327.htm 0 of 54 R - 45 of 46 D https://www.senate.gov/legislative/LIS/roll_call_votes/vote1141/vote_114_1_00326.htm 52 of 54 R – 0 of 46 D https://www.senate.gov/legislative/LIS/roll_call_votes/vote1141/vote_114_1_00322.htm 2 of 54 R – 45 of 46 D https://www.senate.gov/legislative/LIS/roll_call_votes/vote1141/vote_114_1_00321.htm 4 of 54 R – 44 of 46 D https://www.senate.gov/legislative/LIS/roll_call_votes/vote1141/vote_114_1_00320.htm 52 of 54 R – 1 of 46 D https://www.senate.gov/legislative/LIS/roll_call_votes/vote1141/vote_114_1_00319.htm 1 of 54 R – 44 of 46 D https://www.senate.gov/legislative/LIS/roll_call_votes/vote1141/vote_114_1_00318.htm 53 of 54 R – 2 of 46 D https://www.senate.gov/legislative/LIS/roll_call_votes/vote1141/vote_114_1_00317.htm 2 of 54 R – 45 of 46 D https://www.senate.gov/legislative/LIS/roll_call_votes/vote1141/vote_114_1_00315.htm 0 of 54 R - 46 of 46 D https://www.senate.gov/legislative/LIS/roll_call_votes/vote1141/vote_114_1_00313.htm 0 of 54 R - 45 of 46 D https://www.senate.gov/legislative/LIS/roll_call_votes/vote1141/vote_114_1_00293.htm [X] 18 of 54 R – 46 of 46 D https://www.senate.gov/legislative/LIS/roll_call_votes/vote1141/vote_114_1_00276.htm [X] 50 of 54 R – 21 of 46 D https://www.senate.gov/legislative/LIS/roll_call_votes/vote1141/vote_114_1_00142.htm 13 of 54 R – 45 of 46 D https://www.senate.gov/legislative/LIS/roll_call_votes/vote1141/vote_114_1_00123.htm 5 of 54 R – 46 of 46 D https://www.senate.gov/legislative/LIS/roll_call_votes/vote1141/vote_114_1_00097.htm 4 of 54 R – 0 of 46 D (To increase new budget authority for fiscal years 2016 and 2017 and modify outlays for fiscal years 2016 through 2022 for National Defense (budget function 050) with offsets.) This was a huge vote & displayed how much pull the Military Industrial Crony Capitalist Public/Private Partnership Taxpayer-funded Trough has in Washington. I am not shocked the vote failed, but I am shocked at how few people were willing to vote along w/ Rand Paul. https://www.senate.gov/legislative/LIS/roll_call_votes/vote1141/vote_114_1_00096.htm 31 of 54 R - 1 of 46 D https://www.senate.gov/legislative/LIS/roll_call_votes/vote1141/vote_114_1_00090.htm 2 of 54 R – 44 of 45 D https://www.senate.gov/legislative/LIS/roll_call_votes/vote1141/vote_114_1_00084.htm 6 of 54 R – 45 of 46 D https://www.senate.gov/legislative/LIS/roll_call_votes/vote1141/vote_114_1_00143.htm [X] 25 of 54 R – 46 of 46 D https://www.senate.gov/legislative/LIS/roll_call_votes/vote1141/vote_114_1_00140.htm 0 of 54 R - 43 of 46 D https://www.senate.gov/legislative/LIS/roll_call_votes/vote1141/vote_114_1_00138.htm 4 of 54 R – 46 of 46 D https://www.senate.gov/legislative/LIS/roll_call_votes/vote1141/vote_114_1_00129.htm 47 of 54 R – 2 of 46 D 8 of 31 in the 114th *** 113th Congress-1st session (2013) https://www.senate.gov/legislative/LIS/roll_call_votes/vote1131/vote_113_1_00207.htm 14 of 46 R – 54 of 54 D https://www.senate.gov/legislative/LIS/roll_call_votes/vote1131/vote_113_1_00162.htm 14 of 46 R – 54 of 54 D 113th Congress-2nd session (2014) https://www.senate.gov/legislative/LIS/roll_call_votes/vote1132/vote_113_2_00253.htm [X] 34 of 45 R – 52 of 55 D https://www.senate.gov/legislative/LIS/roll_call_votes/vote1132/vote_113_2_00252.htm 0 of 45 R – 50 of 55 D https://www.senate.gov/legislative/LIS/roll_call_votes/vote1132/vote_113_2_00229.htm 44 of 45 R - 4 of 55 D https://www.senate.gov/legislative/LIS/roll_call_votes/vote1132/vote_113_2_00186.htm [X] 22 of 45 R – 53 of 55 D https://www.senate.gov/legislative/LIS/roll_call_votes/vote1132/vote_113_2_00099.htm [X] 5 of 45 R – 55 of 55 D https://www.senate.gov/legislative/LIS/roll_call_votes/vote1132/vote_113_2_00092.htm [X] 10 of 45 R – 54 of 55 D https://www.senate.gov/legislative/LIS/roll_call_votes/vote1132/vote_113_2_00046.htm 2 of 45 R – 54 of 55 D https://www.senate.gov/legislative/LIS/roll_call_votes/vote1132/vote_113_2_00015.htm [X] 9 of 45 R – 55 of 55 D 5 of 10 in the 113th Congress *** Of the 93 votes above to Waive All Budgetary Discipline from 2013-2022 (113th-117th Congress) 30.107% (28) of them were successful. Remember, these votes have a 3/5 threshold, so it always needed some votes from the opposition to be successful. Of those 93 votes, Republicans voted “yea” 52.36% (2,504 of 4,782) of the time. If a Senator was absent from the vote, I assumed he/she was against it & did not bother voting. In votes where the amendment to waive budgetary discipline was *SUCCESSFUL* the GOP voted “yea” (782 of 1,428) 54.76% of the time. Of those 93 votes to Waive All Budgetary Discipline from 2013-2022 (113th-117th Congress), Democrats voted “yea” 55.789% (2,520 of 4,517) of the time. In votes where the amendment to waive budgetary discipline was *SUCCESSFUL* the Dumbasscrats voted “yea” (1,254 of 1,372) 91.399% of the time. The Dummycrats stick together much better than the GOP & in votes where they are close to en masse support they pick off enough GOP squishes to make it happen. I could also say the GOP could stop many of these votes, but not enough of them do so & they cross over, giving the Democrats victory. The reverse does not happen often. We do not have enough Rand Paul or Mike Lees in the Senate to stop this madness. The GOP is like a football team that drives the ball down the field with ease, but they falter in the red zone & have to kick a lot of field goals. The Communists however, are scoring a lot more touchdowns in the red zone. Be careful when perusing this on the Senate website, you cannot always search for “waive all applicable budgetary discipline” because whomever puts this up does NOT always use the same verbiage. Ergo, that is why some of my votes are out-of-order, I always check my work several times & found this later (e.g., sometimes “Motion to Waive All Applicable Budget Points of Order” is used & it will muck up your research). *** Let us do the 112th & 111th Congress too! 112th Congress-2nd session (2012) https://www.senate.gov/legislative/LIS/roll_call_votes/vote1122/vote_112_2_00246.htm 5 of 47 R- 50 of 53 D https://www.senate.gov/legislative/LIS/roll_call_votes/vote1122/vote_112_2_00238.htm 2 of 47 R – 49 of 53 D https://www.senate.gov/legislative/LIS/roll_call_votes/vote1122/vote_112_2_00227.htm 2 of 47 R – 48 of 53 D https://www.senate.gov/legislative/LIS/roll_call_votes/vote1122/vote_112_2_00204.htm 1 of 47 R – 49 of 53 D https://www.senate.gov/legislative/LIS/roll_call_votes/vote1122/vote_112_2_00193.htm 5 of 47 R – 53 of 53 D https://www.senate.gov/legislative/LIS/roll_call_votes/vote1122/vote_112_2_00171.htm [X] 13 of 47 R – 50 of 53 D https://www.senate.gov/legislative/LIS/roll_call_votes/vote1122/vote_112_2_00069.htm [X] 9 of 47 R – 53 of 53 D https://www.senate.gov/legislative/LIS/roll_call_votes/vote1122/vote_112_2_00047.htm 41 of 47 R - 1 of 53 D https://www.senate.gov/legislative/LIS/roll_call_votes/vote1122/vote_112_2_00044.htm 40 of 47 R – 0 of 53 D (To lower the FY13 discretionary budget authority cap as set in the Balanced Budget and Emergency Deficit Control Act of 1985 by $11,000,000,000 in order to offset the general fund transfers to the Highway Trust Fund.) This was not even touching entitlements but was an offset to funds being shifted to highways. Apparently, Democrats are as attached to Discretionary funding as they are bankrupt entitlements https://www.senate.gov/legislative/LIS/roll_call_votes/vote1122/vote_112_2_00035.htm [X] 14 of 47 R – 52 of 53 D 112th Congress-1st session (2011) https://www.senate.gov/legislative/LIS/roll_call_votes/vote1121/vote_112_1_00110.htm [X] 18 of 47 R – 53 of 53 D https://www.senate.gov/legislative/LIS/roll_call_votes/vote1121/vote_112_1_00009.htm 47 of 47 R – 0 of 53 D https://www.senate.gov/legislative/LIS/roll_call_votes/vote1121/vote_112_1_00008.htm [X] (To repeal the expansion of information reporting requirements for payments of $600 or more to corporations, and for other purposes.) I can see why Parkay Teeth Bernie Sanders voted “nay”, he’s never had a private sector job, so he does not understand what it’s like to be buried in red tape & paperwork 47 of 47 R - 34 of 53 D 5 of 13 in the 112th Congress The GOP voted to waive budgetary discipline 39.93% (244 of 611) of the time on all votes & votes where the waiving of budgetary discipline was *SUCCESSFUL* they voted “yea” 42.97% (101 of 235) of the time. The Dumocrat groomers voted to waive budgetary discipline 71.407% (492 of 689) of the time & on votes where the waiver was *SUCCESSFUL* they voted “yea” 91.32% (242 of 265) of the time. *** 111th Congress-2nd session (2010) https://www.senate.gov/legislative/LIS/roll_call_votes/vote1112/vote_111_2_00225.htm [X] 2 of 41 R – 59 of 59 D https://www.senate.gov/legislative/LIS/roll_call_votes/vote1112/vote_111_2_00207.htm [X] 3 of 41 R – 57 of 58 D https://www.senate.gov/legislative/LIS/roll_call_votes/vote1112/vote_111_2_00193.htm 40 of 41 R – 1 of 59 D https://www.senate.gov/legislative/LIS/roll_call_votes/vote1112/vote_111_2_00190.htm 0 of 41 R - 45 of 59 D https://www.senate.gov/legislative/LIS/roll_call_votes/vote1112/vote_111_2_00181.htm 40 of 41 R - 17 of 59 D https://www.senate.gov/legislative/LIS/roll_call_votes/vote1112/vote_111_2_00179.htm 0 of 41 R - 57 of 59 D https://www.senate.gov/legislative/LIS/roll_call_votes/vote1112/vote_111_2_00165.htm 39 of 41 R – 12 of 59 D https://www.senate.gov/legislative/LIS/roll_call_votes/vote1112/vote_111_2_00161.htm [X] 3 of 41 R – 57 of 59 D https://www.senate.gov/legislative/LIS/roll_call_votes/vote1112/vote_111_2_00151.htm 40 of 41 R - 7 of 59 D https://www.senate.gov/legislative/LIS/roll_call_votes/vote1112/vote_111_2_00112.htm [X] 1 of 41 R - 59 of 59 D https://www.senate.gov/legislative/LIS/roll_call_votes/vote1112/vote_111_2_00110.htm 1 of 41 R - 57 of 59 D https://www.senate.gov/legislative/LIS/roll_call_votes/vote1112/vote_111_2_00102.htm 40 of 41 R - 2 of 59 D https://www.senate.gov/legislative/LIS/roll_call_votes/vote1112/vote_111_2_00099.htm 39 of 41 R – 0 of 59 D https://www.senate.gov/legislative/LIS/roll_call_votes/vote1112/vote_111_2_00094.htm 40 of 41 R – 5 of 59 D https://www.senate.gov/legislative/LIS/roll_call_votes/vote1112/vote_111_2_00093.htm 40 of 41 R – 0 of 59 D https://www.senate.gov/legislative/LIS/roll_call_votes/vote1112/vote_111_2_00091.htm 37 of 41 R - 3 of 59 D https://www.senate.gov/legislative/LIS/roll_call_votes/vote1112/vote_111_2_00089.htm 36 of 41 R – 0 of 59 D https://www.senate.gov/legislative/LIS/roll_call_votes/vote1112/vote_111_2_00088.htm 39 of 41 R – 1 of 59 D https://www.senate.gov/legislative/LIS/roll_call_votes/vote1112/vote_111_2_00085.htm 39 of 41 R - 3 of 59 D https://www.senate.gov/legislative/LIS/roll_call_votes/vote1112/vote_111_2_00082.htm 40 of 41 R - 2 of 59 D https://www.senate.gov/legislative/LIS/roll_call_votes/vote1112/vote_111_2_00077.htm 40 of 41 R - 3 of 59 D https://www.senate.gov/legislative/LIS/roll_call_votes/vote1112/vote_111_2_00071.htm 40 of 41 R – 0 of 59 D (To enroll Members of Congress in the Medicaid program) I guess no Democrats wanted to take the health care program that they want all their perpetually-unemployed voters to have https://www.senate.gov/legislative/LIS/roll_call_votes/vote1112/vote_111_2_00059.htm 39 of 41 R – 2 of 59 D https://www.senate.gov/legislative/LIS/roll_call_votes/vote1112/vote_111_2_00058.htm 0 of 41 R - 27 of 59 D https://www.senate.gov/legislative/LIS/roll_call_votes/vote1112/vote_111_2_00057.htm 40 of 41 R - 16 of 59 D https://www.senate.gov/legislative/LIS/roll_call_votes/vote1112/vote_111_2_00054.htm [X] 6 of 41 R – 57 of 59 D https://www.senate.gov/legislative/LIS/roll_call_votes/vote1112/vote_111_2_00052.htm 36 of 41 R - 5 of 59 D https://www.senate.gov/legislative/LIS/roll_call_votes/vote1112/vote_111_2_00042.htm 41 of 41 R - 18 of 59 D https://www.senate.gov/legislative/LIS/roll_call_votes/vote1112/vote_111_2_00041.htm 22 of 41 R – 0 of 59 D 111th Congress-1st session (2009) https://www.senate.gov/legislative/LIS/roll_call_votes/vote1111/vote_111_1_00383.htm [X] 4 of 40 R – 59 of 60 D (this one was a budget buster deluxe, but hey, we have the money!) https://www.senate.gov/legislative/LIS/roll_call_votes/vote1111/vote_111_1_00339.htm 24 of 40 R – 8 of 60 D https://www.senate.gov/legislative/LIS/roll_call_votes/vote1111/vote_111_1_00337.htm 37 of 40 R - 5 of 60 D https://www.senate.gov/legislative/LIS/roll_call_votes/vote1111/vote_111_1_00303.htm 16 of 40 R - 18 of 60 D https://www.senate.gov/legislative/LIS/roll_call_votes/vote1111/vote_111_1_00301.htm [X] 1 of 40 R - 60 of 60 D https://www.senate.gov/legislative/LIS/roll_call_votes/vote1111/vote_111_1_00269.htm [X] 5 of 40 R- 55 of 60 D https://www.senate.gov/legislative/LIS/roll_call_votes/vote1111/vote_111_1_00268.htm 39 of 40 R – 8 of 60 D https://www.senate.gov/legislative/LIS/roll_call_votes/vote1111/vote_111_1_00266.htm 37 of 40 R- 4 of 60 D https://www.senate.gov/legislative/LIS/roll_call_votes/vote1111/vote_111_1_00265.htm 39 of 40 R – 7 of 60 D https://www.senate.gov/legislative/LIS/roll_call_votes/vote1111/vote_111_1_00260.htm [X] 4 of 40 R – 56 of 60 D https://www.senate.gov/legislative/LIS/roll_call_votes/vote1111/vote_111_1_00253.htm [X] 15 of 40 R – 56 of 60 D https://www.senate.gov/legislative/LIS/roll_call_votes/vote1111/vote_111_1_00251.htm 22 of 40 R – 12 of 60 D https://www.senate.gov/legislative/LIS/roll_call_votes/vote1111/vote_111_1_00244.htm 37 of 40 R – 1 of 60 D https://www.senate.gov/legislative/LIS/roll_call_votes/vote1111/vote_111_1_00209.htm [X] 4 of 40 R – 56 of 59 D https://www.senate.gov/legislative/LIS/roll_call_votes/vote1111/vote_111_1_00192.htm 40 of 40 R - 19 of 59 D (To enhance public knowledge regarding the national debt by requiring the publication of the facts about the national debt on IRS instructions, Federal websites, and in new legislation.) https://www.senate.gov/legislative/LIS/roll_call_votes/vote1111/vote_111_1_00191.htm 1 of 40 R – 32 of 59 D https://www.senate.gov/legislative/LIS/roll_call_votes/vote1111/vote_111_1_00183.htm 39 of 40 R - 11 of 59 D https://www.senate.gov/legislative/LIS/roll_call_votes/vote1111/vote_111_1_00150.htm 34 of 41 R - 2 of 58 D (To provide for a point of order against any appropriations bill that fails fully fund the construction of the Southwest border fence.) Democrats had begun their “let us make it as easy as possible for illegal immigration to occur” metamorphosis https://www.senate.gov/legislative/LIS/roll_call_votes/vote1111/vote_111_1_00149.htm 24 of 41 R - 4 of 58 D https://www.senate.gov/legislative/LIS/roll_call_votes/vote1111/vote_111_1_00145.htm [X] 40 of 41 R – 23 of 58 D https://www.senate.gov/legislative/LIS/roll_call_votes/vote1111/vote_111_1_00144.htm 41 of 41 R - 5 of 58 D https://www.senate.gov/legislative/LIS/roll_call_votes/vote1111/vote_111_1_00125.htm 0 of 41 R - 42 of 58 D https://www.senate.gov/legislative/LIS/roll_call_votes/vote1111/vote_111_1_00084.htm 26 of 41 R – 0 of 58 D https://www.senate.gov/legislative/LIS/roll_call_votes/vote1111/vote_111_1_00063.htm [X] 3 of 41 R – 58 of 58 D (this one was a budget buster deluxe) https://www.senate.gov/legislative/LIS/roll_call_votes/vote1111/vote_111_1_00060.htm [X] 3 of 41 R – 58 of 58 D (this one was also a budget buster) https://www.senate.gov/legislative/LIS/roll_call_votes/vote1111/vote_111_1_00058.htm 35 of 41 R – 0 of 58 D https://www.senate.gov/legislative/LIS/roll_call_votes/vote1111/vote_111_1_00055.htm [X] 23 of 41 R – 58 of 58 D https://www.senate.gov/legislative/LIS/roll_call_votes/vote1111/vote_111_1_00049.htm 37 of 41 R – 0 of 58 D https://www.senate.gov/legislative/LIS/roll_call_votes/vote1111/vote_111_1_00048.htm 35 of 41 R – 0 of 58 D https://www.senate.gov/legislative/LIS/roll_call_votes/vote1111/vote_111_1_00045.htm 40 of 41 R – 0 of 58 D https://www.senate.gov/legislative/LIS/roll_call_votes/vote1111/vote_111_1_00043.htm 37 of 41 R – 2 of 58 D https://www.senate.gov/legislative/LIS/roll_call_votes/vote1111/vote_111_1_00042.htm 37 of 41 R – 0 of 58 D https://www.senate.gov/legislative/LIS/roll_call_votes/vote1111/vote_111_1_00041.htm 37 of 41 R – 1 of 58 D https://www.senate.gov/legislative/LIS/roll_call_votes/vote1111/vote_111_1_00040.htm 40 of 41 R - 4 of 58 D https://www.senate.gov/legislative/LIS/roll_call_votes/vote1111/vote_111_1_00038.htm 36 of 41 R – 0 of 58 D https://www.senate.gov/legislative/LIS/roll_call_votes/vote1111/vote_111_1_00036.htm 33 of 41 R - 9 of 58 D https://www.senate.gov/legislative/LIS/roll_call_votes/vote1111/vote_111_1_00035.htm [X] 31 of 41 R – 40 of 58 D https://www.senate.gov/legislative/LIS/roll_call_votes/vote1111/vote_111_1_00033.htm 2 of 41 R – 56 of 58 D 16 of 67 in the 111th Congress Of those 67 votes to eschew budgetary discipline, GOP Senators voted (1,741 of 2,730) “yea” 63.772% of the time. On votes where the waiver was *SUCCESSFUL* the GOP voted “yea” (148 of 650) 22.769% of the time. Of those 67 votes to ignore budgetary discipline, Dumbasscrat Senators voted “yea” (1,401 of 3,944) 35.53% of the time. Pertaining to votes where the waiver was *SUCCESSFUL* Dummycrats voted “yea” (868 of 943) 92.046% of the time. We can see from that, who is better at sticking together to ignore fiscal responsibility – it is no contest. Adding the 112th & 111th Congress’ together, GOP Senators voted to ignore budgetary discipline (1,985 of 3,341) 59.413% of the time. When waiver votes were *SUCCESSFUL* GOP Senators voted “yea” (249 of 885) 28.135% of the time. Adding the 112th & 111th Congress’ together, Democrat Senators voted to ignore budgetary discipline (1,893 of 4,633) 40.859% of the time. When waiver votes were *SUCCESSFUL* Democrat Senators voted “yea” (1,110 of 1,208) 91.887% of the time. AGAIN, we can see who sticks together to avoid budgetary discipline & they stick together much better than the GOP does. Granted, those 2 Congress’ had sizeable Dumocrat majorities, but the story is always the same. There are enough George Voinovich, Susan Collins (and yes, I would prefer Susan over Sara Gideon, but Collins is a squish) & Arlen Specter characters in the GOP that they convince a few of these squishes & are able to win some of these votes. In the 111th & 112th there were 80 attempts to waive fiscal sanity (21 successful), whereas from the 113th-117th there were only 93 (28 successful). You can see when the Dums had bigger majorities, they went crazy & they were drunk w/ power trying to ram though (and sticking together when the minority had an amendment, some good, some bad) anything & everything. This is why they must be stopped & I will again appeal to any voters living in MT, WV, AZ or OH. You will have GOP Senate primaries in the summer of 2024 – if there is a Rand Paul, Mike Lee or Thomas Massie type candidate running, you owe it to this country to get to your primary & support them. ALL THOSE RACES ARE WINNABLE! Do you want more Susan Collins’ in the Senate or more Rand Paul’s? Do you want more George Voinovich & Mitt Romney or more Mike Lee? If you are in UT, do everything to make sure next year is Mitt Romney’s last full year in the Senate. Capiche? It was Democrat dark money (that they abhor of course) that was funding these fly-by-night websites (the Fix the Senate site has not been updated for 8 months, likely another offshoot will pop up & then go up in smoke) demanding that the filibuster be ended. It was not grassroots, it is AstroTurf. https://www.influencewatch.org/non-profit/sixteen-thirty-fund/ https://www.theepochtimes.com/big-left-wing-dark-money-groups-fund-schumers-secretive-anti-filibuster-ally_4192441.html https://www.theepochtimes.com/preeminent-washington-network-raised-over-1-5-billion-in-dark-money-for-funding-liberal-causes_4866732.html ***Fix Our Senate, the obscure outfit leading a coalition of 70 liberal advocacy groups backing Senate Majority Leader Chuck Schumer’s (D-N.Y.) anti-filibuster drive, is a left-wing “dark-money pop-up,” according to a political nonprofit finance expert. “Fix Our Senate may present itself as a standalone, grassroots activist group, but it’s actually a front for the Sixteen Thirty Fund, itself part of a $1.7 billion left-wing ‘dark- money pop-up’ empire run by the shadowy consulting firm Arabella Advisors,” said Capital Research Center (CRC) senior investigative researcher Hayden Ludwig. “We call these fronts ‘pop-ups’ because they’re websites which pop into existence, run attack campaigns, and disappear in an instant and almost never reveal their connection to Arabella or its nonprofits,” Ludwig told The Epoch Times on Jan. 4. [NOTE: This likely explains their site being in limbo for 8 months now]… Schumer promised earlier this week to seek a vote by Jan. 17 on abolishing or reforming the filibuster—the Senate’s “cloture” rule that requires 60 votes to end debate and vote on a proposal—if Senate Republicans block consideration of two election reform packages that are top priorities of the Democrats’ progressive, or far-left, faction. Republicans argue the reforms—the John R. Lewis Voting Rights Advancement Act and the Freedom to Vote Act—severely limit or eliminate entirely the use of photo IDs and related ballot security measures, and require that all proposed changes to state election laws have prior Department of Justice (DOJ) approval. Measures such as strengthening voter identification requirements are highly popular with the public, with recent surveys by Rasmussen, Monmouth, Pew, and AP-NORC finding 72 to 80 percent support for requiring photo IDs to vote. Fix Our Senate describes itself as a “coalition of more than 70 organizations (and counting) representing millions of Americans fighting to eliminate the filibuster and fix the Senate so our elected officials can finally start delivering on their promises.” While no individuals are identified as officials on Fix Our Senate’s website, Eli Zupnick is identified by The Hill as a “spokesman.” He’s cited as praising Schumer for making “the choice clear: Senate Democrats must now choose between protecting our democracy or stubbornly preserving an outdated and abused Senate rule.” The Epoch Times received no response to its questions submitted through the “Press Inquiries” contact form on the Fix Our Senate website by press time. Zupnick, who identifies himself with Fix Our Senate on his Twitter profile page, didn’t respond to multiple requests for comment. He’s the former longtime communications director for Sen. Patty Murray (D-Wash.), working for her in various positions from 2009 until 2019. He also was briefly in 2019 the managing principal for Precision Strategies, a Washington and New York City political consulting and marketing firm co-founded by Stephanie Cutter, who identifies herself as the former deputy campaign manager for President Barack Obama’s 2012 reelection campaign. Among the 70 organizations participating in the Fix Our Senate coalition are the American Muslim Civil Rights Center, Citizens for Responsibility and Ethics in Washington (CREW), Equal Justice Society, Faith in Public Life, Friends of the Earth, League of Conservation Voters, Peoples’ Action, Right to Health Action, and United We Dream. Many of the participating groups are locally focused activists groups such as the Long Beach Alliance for Clean Energy and Mid-Ohio Valley Climate Action. Many of the coalition members, whether nationally or locally focused, share one thing in common—significant funding from the Sixteen Thirty/Arabella Fund dark money network, according to Ludwig. “Because Fix Our Senate and other ‘pop-ups’ aren’t real nonprofits, they don’t file IRS Form 990 disclosures or publicly report their budgets, boards, or lobbying–making it impossible to trace their donors,” Ludwig explained. “Instead, all that money moves through the Sixteen Thirty Fund, itself created and managed by the for-profit company Arabella Advisors as a way for liberal mega-donors to quietly fund many of the Left’s most extreme causes.” Ludwig said CRC has “traced about $10 million flowing from Arabella’s network funded by anonymous liberal donors to signatories on Fix Our Senate’s anti-filibuster coalition.”*** And: ***Washington-based consulting firm Arabella Advisors reportedly raised and spent billions in dark money last year to fund left-wing endeavors. In U.S. politics, dark money refers to anonymous donations aimed at influencing elections. In addition to raising $1.5 billion, Arabella also spent $1 billion to support its causes in 2021, according to a Fox News report that cited tax documents. In an interview with the media outlet, Caitlin Sutherland, the executive director of Americans for Public Trust, pointed to tax returns as proof that Arabella is the “largest dark money player” in U.S. politics. “This network has established itself as the preeminent hub on the left to finance efforts to defund the police, pack the Supreme Court, enforce radical green energy policies, and prop up the Biden administration’s failing agenda,” Sutherland said. Arabella is set up as a limited liability company (LLC), meaning that it is privately owned and thus does not come under the purview of disclosure laws that are applicable to political advocacy groups and nonprofits. As such, billionaires, for example, can easily flood money into Arabella, which the organization can then channel to other funds without the public ever knowing the individuals who are financially backing the entity or the agenda. Arabella manages five nonprofits, which, in turn, have connections with numerous other groups. The New Venture Fund is the largest of the nonprofits, collecting $955 million last year and spending $553 million. [NOTE: Remember that the next time Democrats whine about “dark money”] Earlier this year, Senate Majority Leader Chuck Schumer (D-N.Y.) pushed forward a campaign to abolish or reform the filibuster, which is the Senate’s “cloture” rule that requires 60 votes to end a debate. The move to end the filibuster was supported by an outfit called Fix Our Senate. In an interview with The Epoch Times, Hayden Ludwig, a senior investigative researcher at the Capital Research Center, pointed out that even though Fix Our Senate presents itself as a standalone organization, it is actually a “front for the Sixteen Thirty Fund.” Governing for Impact, a group that works behind the scenes to shape policy in the Biden administration, has connections with Arabella. Financier George Soros is said to have contributed millions to the outfit. Campaign for Our Shared Future, a group that acted against those who opposed teaching critical race theory in schools, also carries ties with Arabella. Marc Elias, a top Democrat attorney, who had earlier pushed the “Russia collusion” hoax and previously served as Hillary Clinton’s campaign lawyer, registered Democracy Docket LLC in July 2020 to advocate for liberal election causes. Elias then formed the Democracy Docket Legal Fund, a fiscally sponsored project of the nonprofit Hopewell Fund that comes under Arabella.*** Fix our Senate & the autistics behind it characterize the filibuster as a relic of Jim Crow & if by Jim Crow you mean Woodrow Wilson, then perhaps (see my section on the “Filibuster” here http://freewebs.com/professor_enigma/bernie-sanders & https://www.youtube.com/watch?v=S9u2U4r4A4s where I demolished a drug addict on YouTube named “Old Fart Rants” on his felonious, foolish, Senate filibuster follies. The old man needs a civics course & then a history class) it is racist. If by “the filibuster is a construct of the modern Senate” they mean “1837”, https://www.realclearpolitics.com/articles/2021/06/07/lets_get_our_filibuster_history_right_145882.html then yes -- the Senate filibuster is a “modern” construct. If the filibuster not being ensconced in the Constitution or not part of the very first convening of the Senate in 1789 is a problem then I could point out that popular election of Senators was not part of the original Founding as well, but I doubt they would want to go back to State Legislatures appointing Senators as it is tougher for their dark money to have an impact in that scenario. Was the “previous question” motion a part of the first Senate meeting or first convening of the House? Why did the Senate scuttle it & the House not? A lot of the objections from the fascist, anti-filibuster crown are very adolescent. How about a simple majority of override a POTUS veto? Fix The Senate & their George Soros allies autistically-repeat the word “Democracy” & then in the next breath whine that the Senate itself is constructed to allow gridlock to flourish. Uh, yeah! If the Founders (and I raised A LOT of these points in my essay on “Parkay Teeth” Bernie Sanders, no need to fill the amendment tree here) intended on us being a “Democracy” they would not have given each state 2 Senators, period. IT’S NOT A DEMOCRACY dummy! The Electoral College is not “Democracy” & neither is the House & Senate arrangements to choose the POTUS & VP in the even nobody gets a majority (and that’s MAJORITY, NOT PLURALITY) of Electoral Votes. The Founders gave each state 2 Senators (and the ability to define & reform their own rules – which spawned the filibusters like it or not & it has stuck around, like it or not because most Senators like them – until they don’t like them & want to ram Republic-burning legislation down our throats w/ 51 votes out of 101) because they believed that the smaller states would stick together when the bigger states tried to bully them. That’s why they did not explicitly give the Senate a filibuster in our founding documents & it has nothing to do w/ racism or Jim Crow & it wasn’t a mistake (unless you’re an idiot who reads book w/ coloring areas in them or a liar). And that concludes my rambling essay on Senate votes to waive budgetary discipline & why Democrats want to end the filibuster. They want to make it easy (remember, one of the reasons the Byrd Rule was constructed was to prevent a group of Senators from attaching say offshore drilling in the Chukchi Sea to a bill designed to fill potholes on the Interstate because it was not germane) for 50.5% (that’s our overweight VP voting w/ 50 Dumocrats) of that elected body to engage in utter insanity. Although the filibuster has failed to prevent a lot of fiscal ineptitude, should it be scuttled it will allow even more (if you can believe that) fiscal insanity that will crush your grandchildren like a grape under a steamroller. Reject these nutcases at the ballot box in 2024! *** https://www.congress.gov/bill/110th-congress/senate-concurrent-resolution/21/text *** Further information that you need to read & then probably take a bath Bernie Sanders WAS worried about the national debt https://www.c-span.org/video/?15245-1/102nd-congress-preview https://freebeacon.com/politics/twenty-six-years-ago-bernie-sanders-criticized-national-debt-of-3-trillion/ https://web.archive.org/web/20151003044743/https://www.youtube.com/watch?v=UmY0-AjnLbg Since the waning days of the George W. Bush regime, “Parkay Teeth” Bernie Sanders has voted to add almost $11 trillion in spending to our federal budget. https://archive.ph/uTsGf Wonder why inflation is becoming a regular problem? This is their plan to rupture the middle class & upper middle class. Compare that to Rand Paul & Mike Lee (both were not seated until the 112th Congress), who are voting the other way, they don’t want a financial catastrophe to bring down the Republic, which Biden & his cronies (as well as several Republicans) are hell-bent on achieving. If you are a voter in MT, WV, AZ or OH during the 20214 Senate primaries & there is a Rand Paul or Mike Lee type candidate on the ballot, get involved in that primary & help them defeat anyone that Mitch McConnell endorses. Mitt Romney needs to be primaried out of the Senate as well. We need more Rand Paul https://archive.ph/J5PqO & Mike Lee https://archive.vn/Bhy0b in the Senate, less Mitch McConnnell & Lisa Murkowski. Capiche? We also need more Thomas Massie https://archive.vn/VD3pS (was not seated until Nov. 2012) as well. https://drrichswier.com/2021/08/13/death-blow-heres-whats-inside-comrade-bernie-sanders-3-5-trillion-budget/ https://www.senate.gov/legislative/LIS/roll_call_votes/vote1171/vote_117_1_00357.htm https://www.congress.gov/bill/117th-congress/senate-coHilncurrent-resolution/14/text/enr Parkay Teeth Bernie Sanders loves him some egregious defense spending, look at the allocations for the Pentagon in Bernie’s legislation. Bernie used to be an honest idiot, I respected him for that, now he has become a Swamp Creature, a Beltway Reptilian who loves to spend egregious amounts of money on virtually everything. He does not give a flying squirrel about the fiscal calamity that will befall your grandchildren because his fat butt will be in the ground. If there are any unemployed Bernie supporters who say, “Those tax cuts were the reason we have deficits”, I suggest you see my Bernie Sanders Tax Hike Challenge, which knocks that out flat. https://rumble.com/v1mjo9w-tell-your-democrat-friends-take-the-bernie-sanders-tax-hike-challenge.html Nancy Pelosi was worried about the national debt & the deficit at one time, but not any more https://www.youtube.com/watch?v=D7lxL90IRew Senator Barack Hussein Obama was worried about our coming fiscal calamity, wanted to stop the debt ceiling from being raised https://redstate.com/diary/alanjoelny/2013/01/15/full-text-of-obamas-speech-against-raising-the-debt-ceiling-in-2006-n179786 Hillary Clinton called our national debt “a national security threat.” https://www.foxnews.com/politics/clinton-national-debt-holding-america-back https://www.theatlantic.com/politics/archive/2016/10/hillary-clinton-national-debt-presidency/504905/ https://www.youtube.com/watch?v=nXd4PhfO3zU https://www.crfb.org/blogs/hillary-clinton-says-national-debt-real-national-security-threat Hey Hillary Clinton, can we go back to the exact tax rates (personal income, corporate income, capital gains, etc.) that were in force when your husband left office, pare back spending levels to FY2019 & allow 1% federal spending growth UNTIL we shave at least $6 trillion off the national debt? Would you vote for that or not? http://freewebs.com/professor_enigma/sam-seder-aoc-tax-the-rich It’s not the tax rates, it’s the spending stupid! Senator Harry Reid discovers the national debt is a problem, too bad he didn’t do that during his numerous decades in Congress https://lasvegastribune.net/2019/07/25/former-nevada-senator-discovers-national-debt/ https://www.youtube.com/watch?v=8e05lVXupwY https://www.huffpost.com/entry/harry-reid-debt-ceiling-mitch-mcconnell_n_561d6122e4b0c5a1ce60da4f https://www.congress.gov/congressional-record/volume-152/issue-34/senate-section/article/S2225-5 (read “Dingy” Harry Reid’s remarks on raising the debt ceiling) The Chuck Schumer of today might want to take the advice of the Chuck Schumer from the George W. Bush Administration. https://www.congress.gov/congressional-record/volume-149/issue-43/senate-section/article/S3815-7 https://townhall.com/tipsheet/guybenson/2021/10/05/flashback-biden-schumer-opposed-raising-the-debt-ceiling-under-unified-gop-government-n2596922 ***“Why do we have a Budget Act? Why do we have a budget resolution? It is to set priorities. If we didn't have to set priorities, we could have as many tax cuts as we wanted and as much spending as we wanted and as big a deficit as we wanted, and the country would be in chaos… I, for one, believe tax cuts are appropriate to stimulate the economy. The amendment wisely allows that… Then, if we do have a crowding out, do people prefer, say, Medicare or tax cuts? Do they prefer education or tax cuts? Do they prefer transportation money or tax cuts? That is what a budget resolution is all about. [note: IF tax cuts stimulate the economy as you say, then why do you have to choose? He contradicted himself]… Last year we were all saying, accountants have to get a whole lot better. Any accountant in his first year of taking an accounting course in college would say: If you have a huge cost coming up--a cost we all support, the cost of the war--don't do other types of things, whether it be spending or cuts, before you know what that cost is.”*** Schumer actually sounds sensible here, as does former Senator Tom Daschle, https://www.congress.gov/congressional-record/volume-149/issue-43/senate-section/article/S3815-7 who called our “exploding federal deficit” a “debilitating debt” for future generations. That was almost 2 decades ago, how bad is it now? Daschle tries to give himself some wiggle room, by crying about tax cuts for folks who pay the majority of taxes – again, see my Bernie Sanders Tax Hike Challenge. BONUS: Senator Rand Paul https://www.congress.gov/congressional-record/volume-168/issue-200/senate-section/article/S10062-1 attempted to increase the voting threshold for budget points of order. 13 Republicans joined all Dumocrats in defeating it. Rand Paul wanted to make it more difficult for Congress to engage in deficit spending sans an offset, most of the Senate would have none of it. There are Senate GOP Primaries in OH, AZ, WV, MT summer of 2024. All those races are winnable for the GOP. If you have a Rand Paul type candidate in that primary, you have a duty to go vote for that person. We need less Lisa Murkowski, less Mitch McConnell & more Rand Paul, more Mike Lee. Mr. Chairman, I Yield Back.736 views -
Senator Rand Paul on foreign aid
UTubekookdetectorSenator Rand Paul, in a recent appearance on the Clay Travis & Buck Sexton Show -- gave a really good answer on foreign aid. He was asked what should the U.S. government do for Israel in light of their never-ending war against Hamas. We need more folks like Rand Paul in the GOP. More Rand Paul, less Lindsay Graham & Mitch McConnell. #endallforeignaid #ronpaulwasright Creepy Sam Seder #samseder #majorityreport is afraid to debate James Patrick Holding on The Impossible Faith https://tektonics.org/lp/nowayjose.php92 views