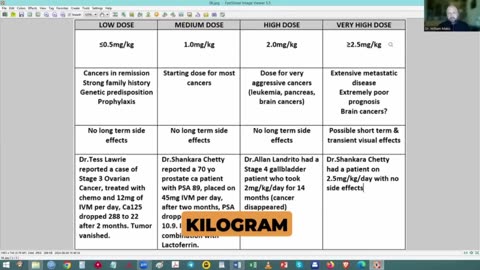
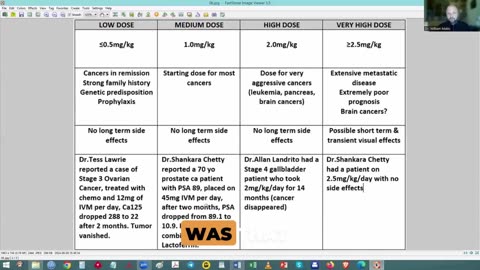
2 months agoKnow anyone with cancer? Then you MUST see this now. Dr Makis made a guideNewsVariableVerified
7 months agoDataRepublican (small r) -DOGE expert Analyst- News Nation Elizabeth Vargas 2 25 2025JUAN O SAVIN PRESENTATIONSVerified
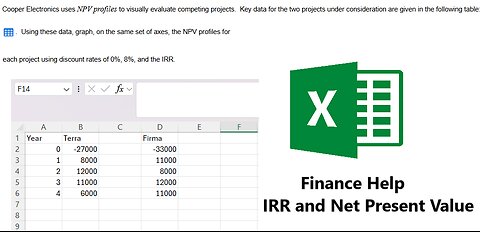
8 months agoFinance Help: Cooper Electronics uses NPV profiles to visually evaluate competing projectssaxi753
5 years agoCanada's COVID-19 Cases Are On The Rise In Multiple Provinces & The Graphs Are WildNarcityCanadaVerified
1 year agoEthical Hacker Exposes Horrors Of Covid-19 Vaccine From EudraVigilance Reporting SystemSunfellow On COVID-19
1 year agoEthical Hacker Exposes Horrors Of Covid-19 Vaccine From EudraVigilance Reporting SystemBaggyPants
2 years agoAre Workers Being Paid Their Product? Watch Out for Misleading ChartsMises InstituteVerified
2 years ago33 Evergrandes? Making sense of China’s economic data and real estate bubbleLei's Real Talk
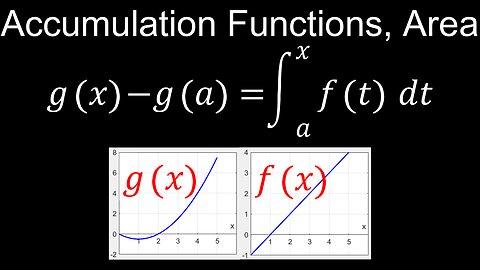
12 days agoBehaviour of Accumulation Functions, Area, Graphical, Numerical, Analytical - CalculusDrOfEng
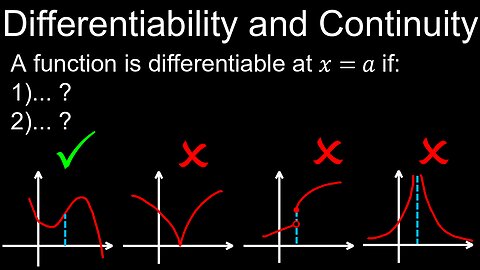
1 month agoDifferentiability and Continuity of Function, Rates of Change, Visual Proof, Example - CalculusDrOfEng
![How to Describe & Visualize a Line in Three Dimensions 3D [ASMR Math, Graph]](https://1a-1791.com/video/s8/1/A/h/E/8/AhE8c.oq1b.2-small-How-to-Describe-and-Visuali.jpg)