2 years agoThe U.N. PSYCHOPATHS ARE AT iT AGAIN! GEARING UP FOR ANOTHER PLANDEMIC! - THIS TIME THEY GONNA BLAME IT ON BUGS!nonvaxer420
2 years agoCDC Reporting System for COVID-19 Injuries & Deaths Missing, Hidden or Inaccurate!DrRobertYoung
2 years agoNasa_Synthesis_Nasa Data Visualization In Ultra HD (4K) | Orbital Odyssey |Orbital Odyssey
6 months agoHAR and mental commands for drones COMMAND & CONTROL ~ HOW DOES YOUR 6G ACTUALLY WORK IN THE 15 MINUTE/COGNITIVE CITIES IN YOUR 4IR? #TellMeHownonvaxer420
1 year agoNewsGPT - The Unhuman Truth. 24/7 News from around the world powered by AINewsGPT | The world’s first 24-hour news channel powered entirely by AI.
1 day agoFootball Club Ranking | Historical Top 10 & Top 100 (1872–2025, Men & Women)Football Club Ranking
1 year agoVAERS coverup of COVID19 bioweapon mortality -Conversation with Albert Benavides -EP 31Humanity United Now - Ana Maria Mihalcea, MD, PhD
1 year agoBNN (Brandenburg News Network) 11/9/2023 Mark Finchem and Seth Keshel, Ralph and KarenBrandenburgForGovernorVerified
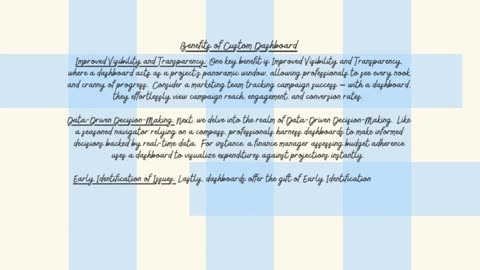
8 months agoCreating Insightful Dashboards: Redmine Plugins for Project Management Data Visualizationemilyjones29
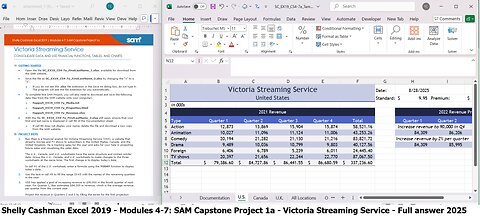
24 days agoShelly Cashman Excel 2019 | Modules 4-7: SAM Capstone Project 1a Victoria Streaming Servicesaxi753