2 years agoHow to Conditionally Format Symbol colors in Excel Tables (without Conditional Formatting)Leila Gharani
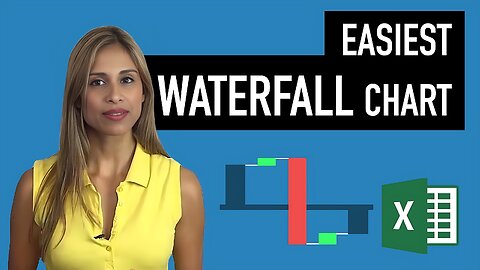
2 years agoEasiest Excel Waterfall Chart (Bridge graph) from Scratch - Works with minus valuesLeila Gharani
1 year agoEthical Hacker Exposes Horrors Of Covid-19 Vaccine From EudraVigilance Reporting SystemBaggyPants
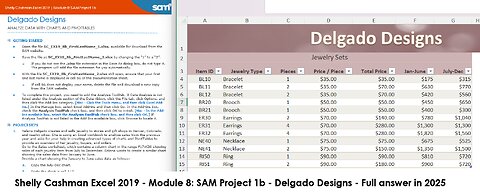
1 month agoShelly Cashman Excel 2019 | Module 8: SAM Project 1b | Delgado Designs (Full answer 2025)saxi753
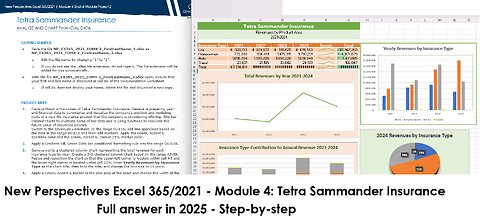
1 month agoNew Perspectives Excel 365/2021 | Module 4: End of Module Project 2 | Tetra Sammander Insurance 2025saxi753
2 years agoHow to Create a DYNAMIC Map Chart With Drop-Down (works with ANY Excel version)Leila Gharani
2 years agoExcel Tables: Best Practice to Create Tables for Financial Reporting in ExcelLeila Gharani
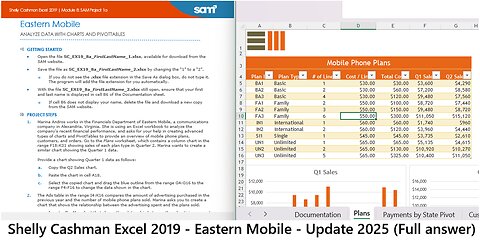
2 months agoShelly Cashman Excel 2019 | Module 8: SAM Project 1a | Eastern Mobile (Update 2025)saxi753
2 years agoExcel 2016 Waterfall Chart - Advantages and Limitations - Ultimate guide to Excel's Bridge GraphLeila Gharani
2 years agoExcel Waterfall Charts: Business Examples of Waterfall Charts and When to Use Them in Your ReportsLeila Gharani
1 year agoNewsGPT | Headline News Entirely Generated by AI | November 21, 2023NewsGPT | The world’s first 24-hour news channel powered entirely by AI.
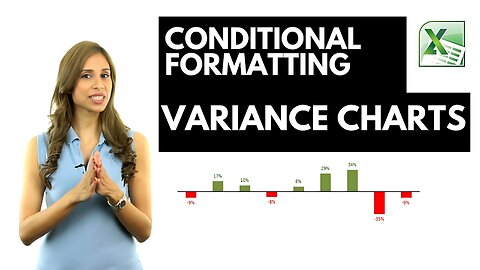
2 years agoExcel Arrow Variance Chart: Dynamic Arrows in Chart to Show Change to Previous Year / BudgetLeila Gharani
2 years agoQuick Analyze Data in Excel | High-level visual summaries, trends, and patterns | Ask Questions NLPRahimZulfiqarAli