Global Atmospheric Methane for Earth Day 2020
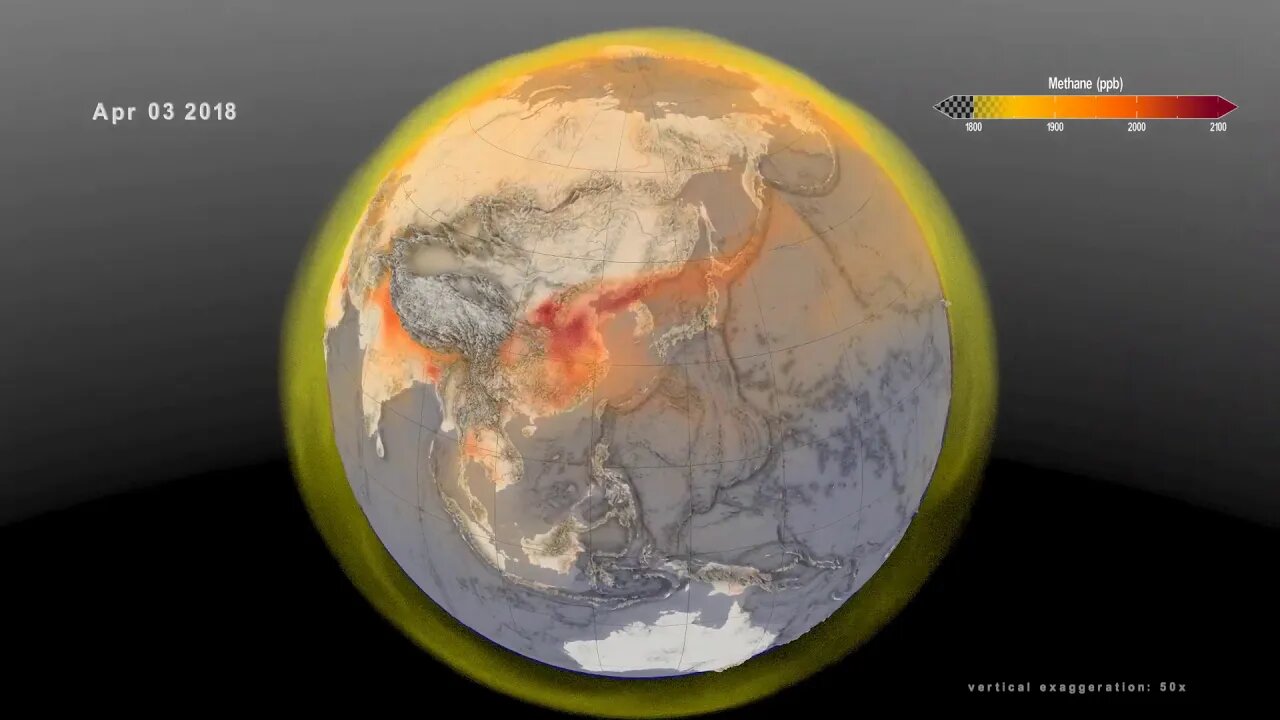
This 3D volumetric visualization shows a global view of the methane emission and transport between December 1, 2017 and November 30, 2018. Methane is a powerful greenhouse gas that traps heat 28 times more effectively than carbon dioxide over a 100-year timescale. Concentrations of methane have increased by more than 150% since industrial activities and intensive agriculture began. After carbon dioxide, methane is responsible for about 20% of climate change in the twentieth century. Methane is produced under conditions where little to no oxygen is available. About 30% of methane emissions are produced by wetlands, including ponds, lakes and rivers. Another 20% is produced by agriculture, due to a combination of livestock, waste management and rice cultivation. Activities related to oil, gas, and coal extraction release an additional 30%. The remainder of methane emissions come from minor sources such as wildfire, biomass burning, permafrost, termites, dams, and the ocean. Scientists around the world are working to better understand the budget of methane with the ultimate goals of reducing greenhouse gas emissions and improving prediction of environmental change. For additional information, see the Global Methane Budget (https://www.globalcarbonproject.org/m...)
The NASA SVS visualization presented here shows the complex patterns of methane emissions produced around the globe and throughout the year from the different sources described above. The visualization was created using output from the Global Modeling and Assimilation Office, GMAO, GEOS modeling system, developed and maintained by scientists at NASA. Wetland emissions were estimated by the LPJ-wsl model, which simulates the temperature and moisture dependent methane emission processes using a variety of satellite data to determine what parts of the globe are covered by wetlands. Other methane emission sources come from inventories of human activity. The height of Earth’s atmosphere and topography have been vertically exaggerated and appear approximately 50-times higher than normal in order to show the complexity of the atmospheric flow.
Outflow from different regions result from different sources. For example, high methane concentrations over South America are driven by wetland emissions while over Asia, emissions reflect a mix of agricultural and industrial activities. Emissions are transported through the atmosphere as weather systems move and mix methane around the globe. In the atmosphere, methane is eventually removed by reactive gases that convert it to carbon dioxide. Understanding the three-dimensional distribution of methane is important for NASA scientists planning observations that sample the atmosphere in very different ways. Satellites like GeoCarb (http://www.ou.edu/geocarb), a planned geostationary mission to observe both carbon dioxide and methane, look down from space and will estimate the total number of methane molecules in a column of air. Aircraft, like those launched during NASA’s Arctic Boreal Vulnerability Experiment (ABOVE) (https://above.nasa.gov/) sample the atmosphere along very specific flight lines, providing additional details about the processes controlling methane emissions at high latitudes. Atmospheric models help place these different types of measurements in context so that scientists can refine estimates of sources and sinks, understand the processes controlling them and reduce uncertainty in future projections of carbon-climate feedbacks.
Visualizers: Cindy Starr (lead), Kel Elkins, Greg Shirah, Trent L. Schindler
Music: Cypher by Wayne Jones
Subscribe now for more videos from over 280 sources plus my own videos!
Subscribe to my entertainment channel or at least peek at my other channel !!! https://www.youtube.com/channel/UCiNFsoytAuun90UzU5AuxXg
https://www.bitchute.com/channel/YsJ0PYUWx5An/
https://www.patreon.com/user?u=26453564
-
 8:44
8:44
Kurt's News
8 months agoKimmel CRIES About Trump, Tapper Gets SCHOOLED on Pete Hegseth & Black Millionaire Claims Racism
158 -
 2:33:19
Right Side Broadcasting Network
8 hours agoLIVE REPLAY: President Trump Makes an Announcement - 10/10/25
64K17 -
 1:53:46
Roseanne Barr
3 hours agoTim Pool | The Roseanne Barr Podcast #119
74.2K50 -
 1:02:20
The White House
2 hours agoPresident Trump Makes an Announcement, Oct. 10, 2025
16K -
 LIVE
LIVE
The Jimmy Dore Show
3 hours agoGaza Ceasefire Is ON — But Will It Hold? Trump CONSIDERING Ghislaine Maxwell Pardon! w/ Ian Carroll
9,627 watching -
 34:45
34:45
Stephen Gardner
2 hours ago🔥Trump's 2 HUGE wins the media REFUSES to report!
16K16 -
 LIVE
LIVE
Dr Disrespect
10 hours ago🔴LIVE - DR DISRESPECT - BATTLEFIELD 6 - THE WAR BEGINS | BF6 LAUNCH DAY
1,437 watching -
 LIVE
LIVE
Nerdrotic
4 hours ago $4.20 earnedTron: Ovaries! | Peacemaker GUNNS Down DCU | Hollywood Death Spiral | Friday Night Tights 375
1,490 watching -
 LIVE
LIVE
LFA TV
19 hours agoLIVE & BREAKING NEWS! | FRIDAY 10/10/25
610 watching -
 1:09:03
vivafrei
6 hours agoCriminals Are Getting Nervous! Democrats Can't Give Trump Credit! AND MORE!
95.4K34