How to make XY scatter plot in Excel
Hello, My Dear Friends, !! In this video, I will show you How to make an XY scatter plot in Excel. Watch the video till the end Thanks.
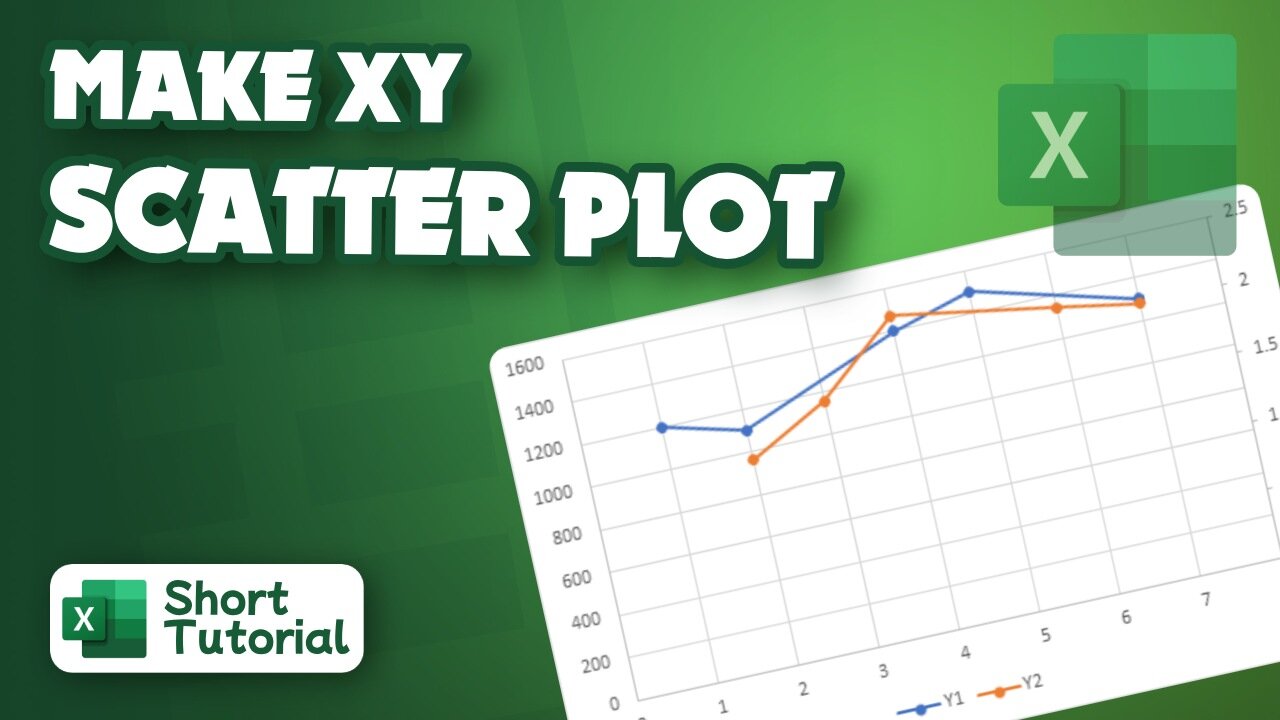
Here,s How to make an XY scatter plot in Excel :
~~~~~~~~~~~~~~~~~~~~~~~~~~~~~~~~~~~~~~~~~~
Step 1: Select the data you want to plot in the chart.
Step 2: Click the Insert tab, and then click X Y Scatter, and under Scatter, pick a chart.
Step 3: With the chart selected, click the Chart Design tab to do any of the following: Click Add Chart Element to modify details like the title, labels, and legend.
Chapters:
0:00 Introduction
0:13 Make XY scatter plot in Excel
2:47 Happy Ending
Thank you Everyone for watching. If this video can help you, don't forget to like & subscribe to my channel.
#initial #solution #make #XY #scatter #plot #in #Excel
-
 LIVE
LIVE
The State of Freedom
2 days agoWarrior Wednesday: Land. Ballots. Power. ⚔️
75 watching -
 LIVE
LIVE
The Big Mig™
1 hour agoBLM’s Wild Horse Extermination The UGLY TRUTH Exposed
3,155 watching -
 1:37:27
Graham Allen
2 hours agoPass The SAVE ACT NOW!! + Melinda Gates Confirms Epstein Files Are TRUE?!?
135K319 -
 LIVE
LIVE
Badlands Media
1 hour agoBadlands Daily: 2/4/26
3,584 watching -
 2:19:16
Connor Tomlinson
6 hours agoShould the Right Support Matt Goodwin?
1.66K -
 1:01:47
BonginoReport
4 hours agoThe GOP Continues To Disappoint | Episode 218 - 02/04/26 VINCE
155K121 -
 1:27:15
Chad Prather
17 hours agoIt’s Coming: How to be Ready for the Evil Day
74.3K35 -
 51:48
51:48
The White House
2 hours agoVice President JD Vance Delivers Remarks at the Critical Minerals Ministerial
18.7K8 -
 25:40
25:40
Liberty Vault
17 hours agoJoe Rogan and Mike Benz Reveal THE TRUTH About the New Epstein Files REVELATIONS
15.5K20 -
 1:08:10
Crypto Power Hour
13 hours ago $2.32 earnedJeffery Epstein’s Bitcoin Op, The Hidden War on XRP, Ripple, & XLM
42.7K6