Premium Only Content
This video is only available to Rumble Premium subscribers. Subscribe to
enjoy exclusive content and ad-free viewing.

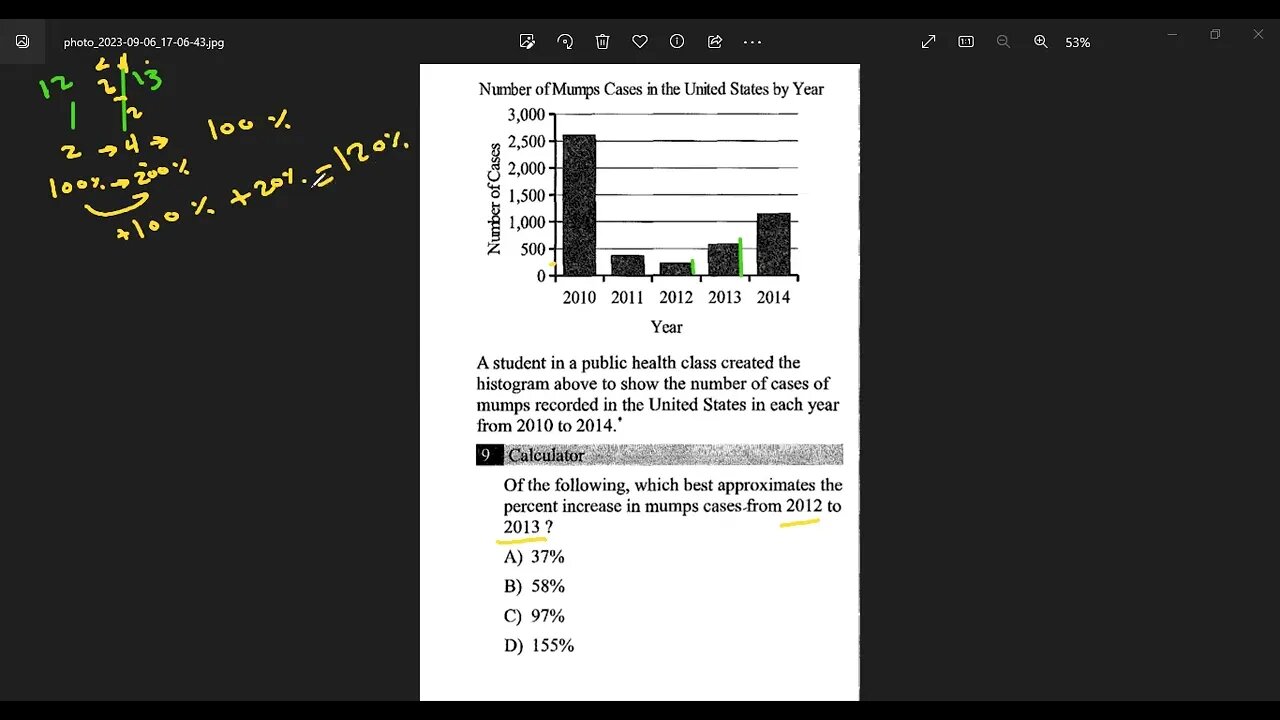
#digitalsat #EST #act, percent & Statistics problem from PWN book
Loading comments...
-
 2:12:02
Mally_Mouse
9 hours ago🎮Throwback Thursday! Let's Play: Wii Sports Resort!
45K2 -

Akademiks
5 hours agoATLANTA IS BACK. Young Thug and YFN best buddies now. ATL backs Thug officially!
55.4K2 -
 5:40:35
Reolock
7 hours agoWoW Classic Hardcore | 3 LEVELS REMAIN
43.1K3 -
 3:00:23
Sgt Wilky Plays
6 hours agoThirst Trap Thursday | Regiment Donor Drive
35.5K -
 4:12:29
Fragniac
7 hours ago🔴 LIVE - FRAGNIAC - THE FINALS - IT'S ABOUT TO BE A MOVIE❗🎬📽 🎞
26.8K2 -
 1:39:44
Glenn Greenwald
8 hours agoJames Comey Indicted; TikTok and CBS Taken Over by IDF Funder Larry Ellison; Republicans Blame Rhetoric for Violence: Is "Stochastic Terrorism" Real? GOP Blocks Release of Epstein Files | SYSTEM UPDATE #521
146K95 -
 DVR
DVR
StevieTLIVE
6 hours agoThursday SOLO Warzone Domination | BDAY at Midnight
12.3K -
 10:34:47
FoeDubb
12 hours ago🏰KINGDOM MENU: 🎮WASTELAND SHENANIGANS ON DA 1ST BORDERLANDS DILLY DILLY!!!!
9.15K -
 15:57
15:57
Robbi On The Record
10 hours ago $0.60 earnedTranshumanism: Are Humans Becoming Obsolete? Neuralink & CRISPR explained
12.8K5 -
 35:15
35:15
Stephen Gardner
6 hours ago🚨 Crazy Revenge Plot Against TRUMP Fails!
17.7K36