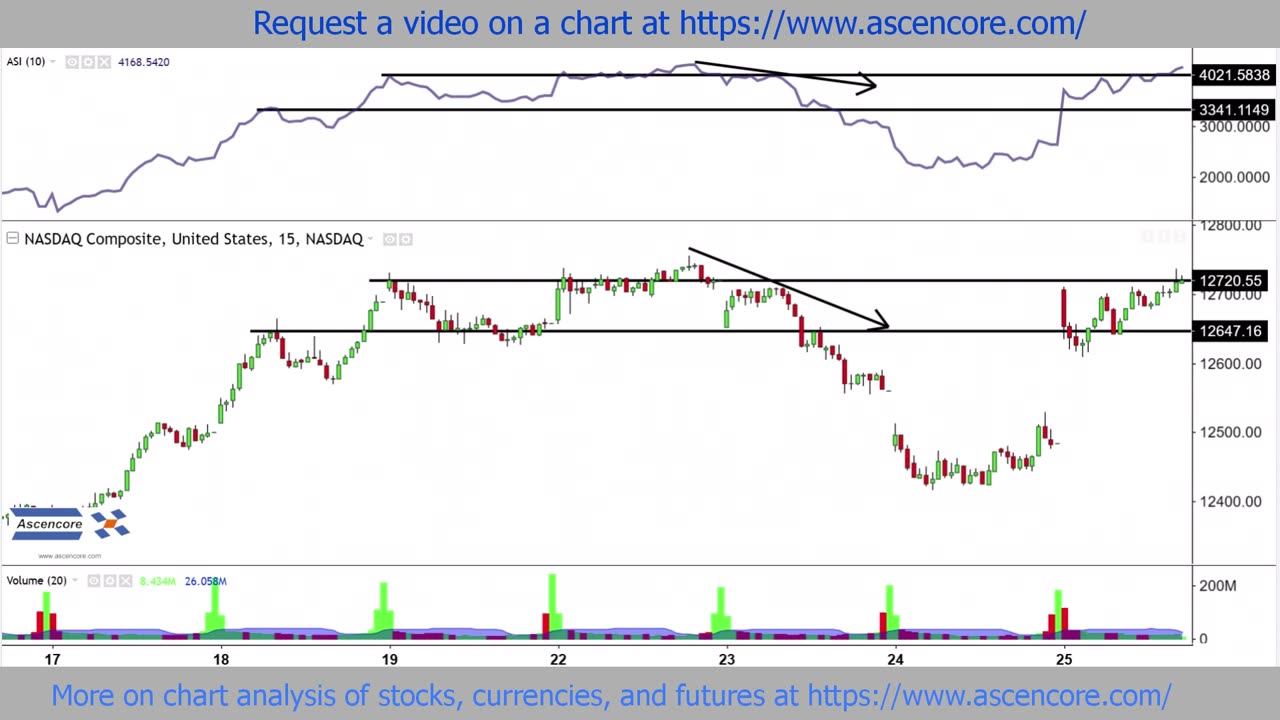
NASDAQ Composite Stock Chart Accumulation Swing Index (ASI) Indicator Analysis Example
2 years ago
13
For more on trading, investing, charting analysis, and helpful information on the stock markets, currencies, and commodity markets, visit https://www.ascencore.com/
Full series on the Accumulative Swing Index (ASI) Indicator here: https://www.youtube.com/playlist?list=PL_KT4xihdLnarp1c7zMW2rItvTawnvZ0z
Loading comments...
-
 7:05
7:05
Ascencore
1 month agoAviation Stock Radar: Archer ACHR, Joby Aviation JOBY, Vertical Aerospace EVTL, New Horizon HOVR
81 -
![[Ep 813] LIVE from Rumble Set at AmFest 2025 | Guests Vem, Midnight, & Kevin Smith](https://1a-1791.com/video/fwe2/31/s8/1/4/F/c/J/4FcJz.0kob-small-Ep-813-LIVE-from-Rumble-Set.jpg) 56:22
56:22
The Nunn Report - w/ Dan Nunn
4 hours ago[Ep 813] LIVE from Rumble Set at AmFest 2025 | Guests Vem, Midnight, & Kevin Smith
24.7K3 -
 29:58
29:58
Stephen Gardner
4 hours ago🔥IT'S BAD! NEW report just DROPPED!
30.5K27 -
 LIVE
LIVE
LFA TV
19 hours agoLIVE & BREAKING NEWS! | THURSDAY 12/18/25
1,166 watching -
 LIVE
LIVE
freecastle
7 hours agoTAKE UP YOUR CROSS- A man’s heart PLANS his way, but the LORD DIRECTS his steps!
94 watching -
 LIVE
LIVE
John Crump Live
1 hour agoChristmas Special
45 watching -
 54:53
54:53
The Quartering
7 hours agoDan Bongino Quits, New Break In Tyler Robinson Case & Brown Shooting!
129K60 -
 2:12:49
Side Scrollers Podcast
6 hours agoTrans Surgeries For Kids CRIMINALIZED + Harassed Target Employee Speaks Out + More | Side Scrollers
89.6K19 -
 1:01:16
Timcast
6 hours agoTrump TROLLS Legacy Media, Announces WARRIOR DIVIDEND, Venezuela Fake Out
203K86 -
 1:04:30
Sean Unpaved
5 hours agoSeahawks Looking For REVENGE Against Rams! | UNPAVED
44.6K1