How to determine frequency of the alleles
Deriving genotypic and allelic frequencies
One definition of a population is its genotypic frequencies. This gives an indication of the genotypes which are the most or least prevalent in the population. The examples that will be used are for the blood type locus. Two alleles are possible, M or N, that can combine to give the following genotypes MM, MN, NN. The following data was collected from a human population.
Genotype # of Individuals Genotypic frequencies
MM 1787 MM = 1787/6129 = 29
MN 3039 MN = 3039/6129 = 50%
NN 1303 NN = 1303/6129 = 21%
Total 6129
The population that we just analyzed has just two alleles at the blood type locus, and each individual will have some combination of these two alleles. Thus, this entire population consists of 12,258 (6129 X 2) blood type alleles at the blood type locus. To deter mine the allelic frequencies we simply count the number of M or N alleles and divide by the total number of alleles. So the allelic frequency for the M allele will be:
f(M) = [(2 x 1787) + 3039]/12,258 = 0.5395
and the frequency for the N allele will be:
f(N) = [(2 x 1303) + 3039]/12,258 = 0.4605
By convention one of the alleles is given the designation P and the other q. Thus for the data we presented above, p=0.5395 and q=0.4605. Because we are analyzing all the alleles, the frequencies shoul d sum to 1.0 and p + q = 1. Furthermore, a population is considered by population geneticists to be polymorphic if two alleles are segregating and if the frequency of the most frequent allele is less than 0.99.
The following quote from one of the classic books on quantitative genetics defines a population in a genetic perspective. The quote is from Introduction to Quantitative Genetics by D. S. Falconer, 1960, Ronald Press.
"A population in the genetic sense, is not just a group of individuals, but a breeding group; and the genetics of a population is concerned not only with the genetic constitution of the individuals but also with the transmission of the genes from one gen eration to the next. In the transmission the genotypes of the parents are broken down and a new set of genotypes is constituted in the progeny, from the genes transmitted in the gametes. The genes carried by the population thus have continuity from gene ration to generation, but the genotypes in which they appear do not. The genetic constitution of a population, referring to the genes it carries, is described by the array of gene frequencies, that is by specification of the alleles present at every locu s and the numbers or proportions of the different alleles at each locus."
The following example will illustrate how to calculate allelic frequencies from genotypic frequencies. It will also demonstrate that two different populations from the same species do not have to have the same allelic frequencies.
Percent
Location MM MN NN p q
Greenland 83.5 15.6 0.9 0.92 0.08
Iceland 31.2 51.5 17.30 0.57 0.43
Let p=f(M) and q=f(N). Thus, p=f(MM) + Ѕ f(MN) and q=f(NN) + Ѕ f(MN). So the results of the above data are: for Greenland p=0.835 + Ѕ (0.156)=0.913 and q=0.009 + Ѕ (0.156)=0.087; and for Iceland p=0.312 + Ѕ (0.515)=0.569 and q=0.173 + Ѕ (0.515)=0.431. Clearly the allelic frequencies vary between these populations.
Deriving Allelic Frequencies from Molecular Data
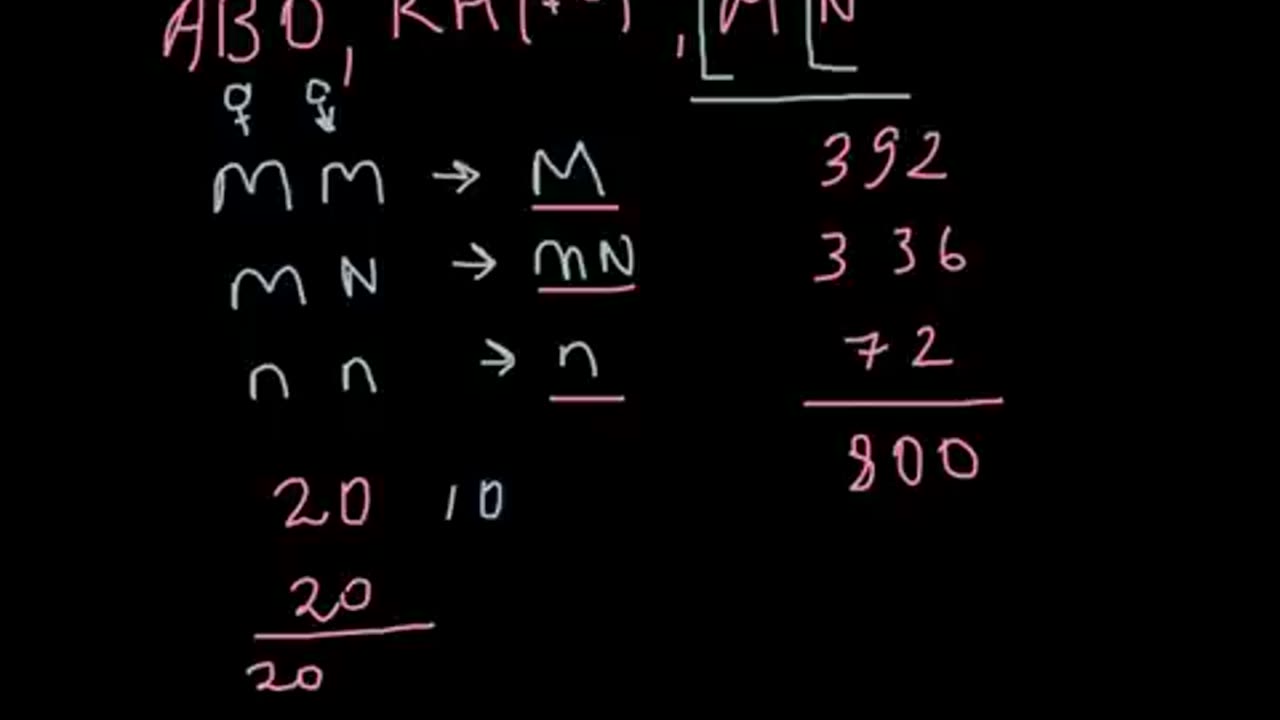
Populations can also be scored with respect to loci scored with molecular probes. The above image displays the variability among humans at one specific locus. Each band can be considered to be an allele of the locus. No two individuals are the same i n this group. The individual whose DNA is found in lane 1 is homozygous. All of the others are heterozygous.. Individuals 2 and 8 share one allele, but differ at the other allele. Likewise individuals 3 and 10 share one allele, but are polymorphic at their second alleles. If a large number of individuals are scored with respect to this locus, then allelic frequencies for each allele (band) can be determined.
Now lets score the allelic frequecies for a locus recognized by a molecular marker. The human population represented by the above image contains individuals with a either 6.5 kb fragments or a 3.0 kb fragment or both fragments. (Remember that those in dividuals with a single band actually contain two copies of that band.) The number of individuals scored with respect to each biochemcal phenotype are given above the band. The allelic frequency of each band can be determined in a similar manner as in t he previous examples. p is the frequence of the 6.5 kb fragment in the population. Its value is p = [(2)(30) + 50]/200 = 0.55. The frequecy of the 3.0kb fragment is then q = [(2)(20) + 50]/200 = 0.45
-
 1:46:23
The HotSeat
12 hours agoCommander In Chief and SECWAR Address The Troops, and I AM HERE FOR IT!
34.9K19 -
 2:07:00
The Michelle Moore Show
2 days ago'President Trump on Radicals, Susie Wiles In Question Again, Erika Kirk Evokes More Questions, Spiritual Calamity Coming For The President?' Guest, Mark Taylor: The Michelle Moore Show (Sept 29, 2025)
41K110 -
 LIVE
LIVE
Lofi Girl
2 years agoSynthwave Radio 🌌 - beats to chill/game to
618 watching -
 33:53
33:53
Stephen Gardner
8 hours ago🔥Antifa PANICS as Trump UNLEASHES Secret Weapon!
39.2K33 -
 2:48:28
Badlands Media
13 hours agoDEFCON ZERQ Ep. 011: RED OCTOBER BEGINS - ARK OF COVENANT - PRECIPICE
148K98 -
 2:08:09
The Charlie Kirk Show
7 hours agoTPUSA Presents This is The Turning Point Tour LIVE with Alex Clark and more!!
96.9K100 -
 1:33:53
Inverted World Live
7 hours agoMan Sees Creature in Loch Ness | Ep. 116
43K7 -
 3:04:06
PandaSub2000
16 hours agoExorcist: Legion VR | PSVR 2000 (Original Live Version)
20K1 -
 2:58:54
SmashJT
4 hours agoCollective Shout Keeps “HARRASSING” Me | Smashcast
26.5K1 -
 3:05:38
StevieTLIVE
5 hours agoWarzone Wins ALL Night w/ GloryJean
28.6K1