Excel Charts & Graphs for Advanced Financial analysis📈
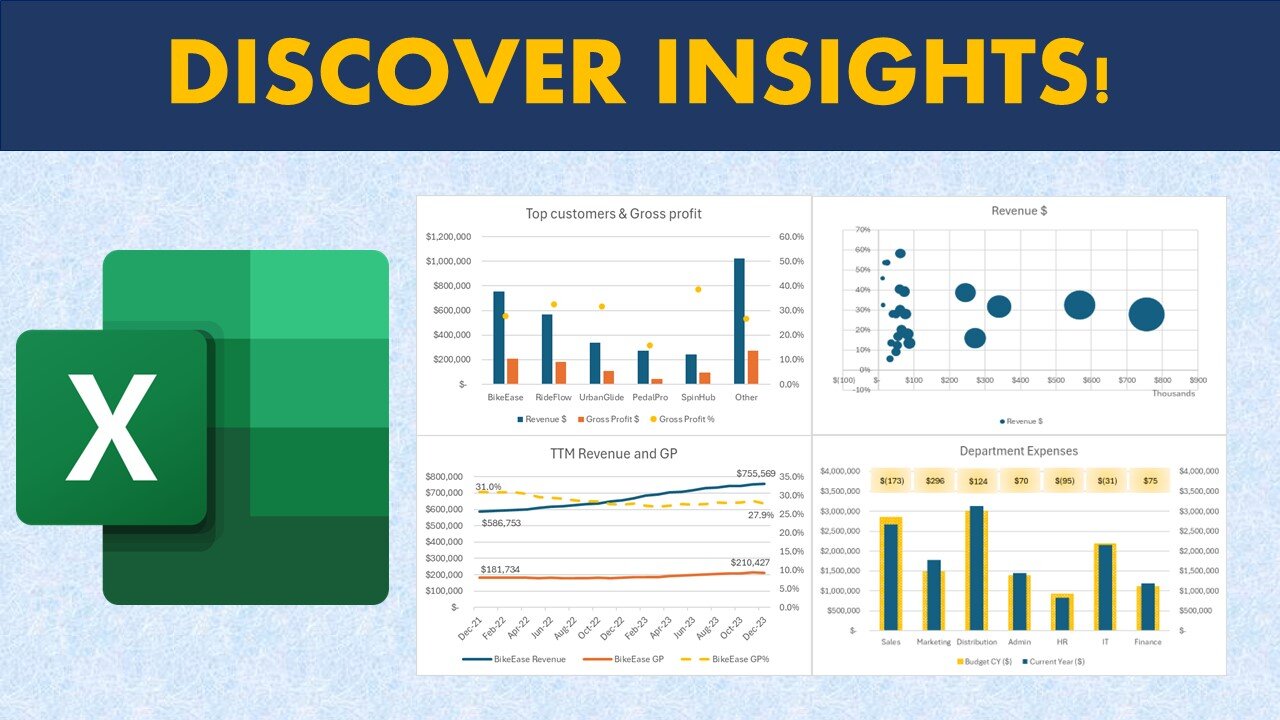
00:16 Chart visualization for Revenue and Gross profit including Profit Margin (%)
00:39 Bubble Chart for customer profitability analysis
01:01 Chart for Revenue and gross profit margin trend (Trend analysis)
01:54 Charts for Expenses vs budget analysis
02:13 Chart to highlight categories of spend vs budget
02:25 Forecast Chart
02:34 Chart for Outlier Analysis
02:54 Create Clustered column charts in Excel
04:17 Create Customer profitability Bubble charts in Excel
05:27 Create Trend Analysis (Line chart) in Excel
07:26 Budget vs Actual spend chart in Excel
09:23 Waterfall Chart for spend analysis in Excel
10:07 Create a forecast chart in Excel
11:36 Create scatter chart for sales commission analysis in Excel
📊 Unlock Financial Insights:
Discover the art of data visualization as we explore advanced techniques for financial analysis. Our step-by-step guide will empower you to go beyond traditional methods, allowing you to unlock valuable financial insights hidden within your datasets.
📈 Revenue and Gross Profit Analysis:
Learn how to conduct thorough revenue and gross profit analysis using dynamic Excel charts. Uncover trends, patterns, and key financial indicators to drive strategic decisions.
📉 Expenses vs Budget:
Navigate the complexities of budgeting and expenses with insightful graphs. We'll guide you through creating visual representations that simplify expense tracking and budget analysis.
🔄 Data Relationships and Forecasting:
Explore the world of data relationships and forecasting through Excel charts. Understand how to identify correlations, predict future trends, and make informed decisions based on your financial data.
🚀 Excel Tips & Techniques:
Whether you're a financial analyst, business professional, or Excel enthusiast, this tutorial is tailored for you. We'll showcase Excel tips and techniques that elevate your financial modeling, budgeting, and reporting skills to new heights.
💡 Tags:
Financial Analysis, Excel Charts, Data Visualization, Financial Modeling, Business Analytics, Excel Tips, Financial Insights, Data Analysis, Graphs Tutorial, Excel for Finance, Financial Reporting, Data Visualization Techniques, Financial Dashboards, Excel Graphing, Budgeting in Excel, Excel Techniques, Visual Data Analysis, Finance Tools, Excel Tutorial, Spreadsheet Analytics
-
 LIVE
LIVE
Barry Cunningham
6 hours agoPRESIDENT TRUMP SPEAKS ON JAMES COMEY INDICTMENT! MORE TO COME! DELICIOUS LIBERAL MELTDOWNS!
1,184 watching -
 25:59
25:59
Simply Bitcoin
1 day ago $0.63 earnedMichael Saylor Reveals $81T Bitcoin Plan to Cancel National Debt?!
9.44K5 -
 1:33:51
Steve-O's Wild Ride! Podcast
1 day ago $0.92 earnedJohn C. Reilly's Surprising Connection To Jackass (And Beef With Weeman!)
22.9K6 -
 LIVE
LIVE
StoneMountain64
3 hours agoBattlefield 6 News and Extraction Gaming
96 watching -
 2:13:30
Side Scrollers Podcast
7 hours agoUK Introduces MANDATORY Digital ID + Dallas ICE Shooting BLAMED on Gaming + More | Side Scrollers
85.8K8 -
 1:54:17
The Charlie Kirk Show
5 hours agoCharlie's Last Trip + What's Next + AMA | Erika Kirk, Mikey McCoy | 9.26.2025
272K243 -
 1:02:53
The Quartering
4 hours agoMAGA Kid Kidnapped, Hasan Piker Meltdown, Vivek Fights For Alex Jones & More
129K50 -
 32:49
32:49
Simply Bitcoin
1 day ago $1.83 earnedBitcoin Crucible w/ Alex Stanczyk | EP 1
36.4K1 -
 1:57:37
Tucker Carlson
4 hours agoCharlie Sheen’s Craziest Hollywood Stories and Why He Refuses to Believe the Official Story of 9/11
60.2K63 -
 1:33:12
Sean Unpaved
5 hours agoRyder Cup Tee-Off, CFB's Week 5 Madness, & the NFL's Win-or-Wilt Week 4
31.9K1