Excel Charts & Graphs for Advanced Financial analysis📈
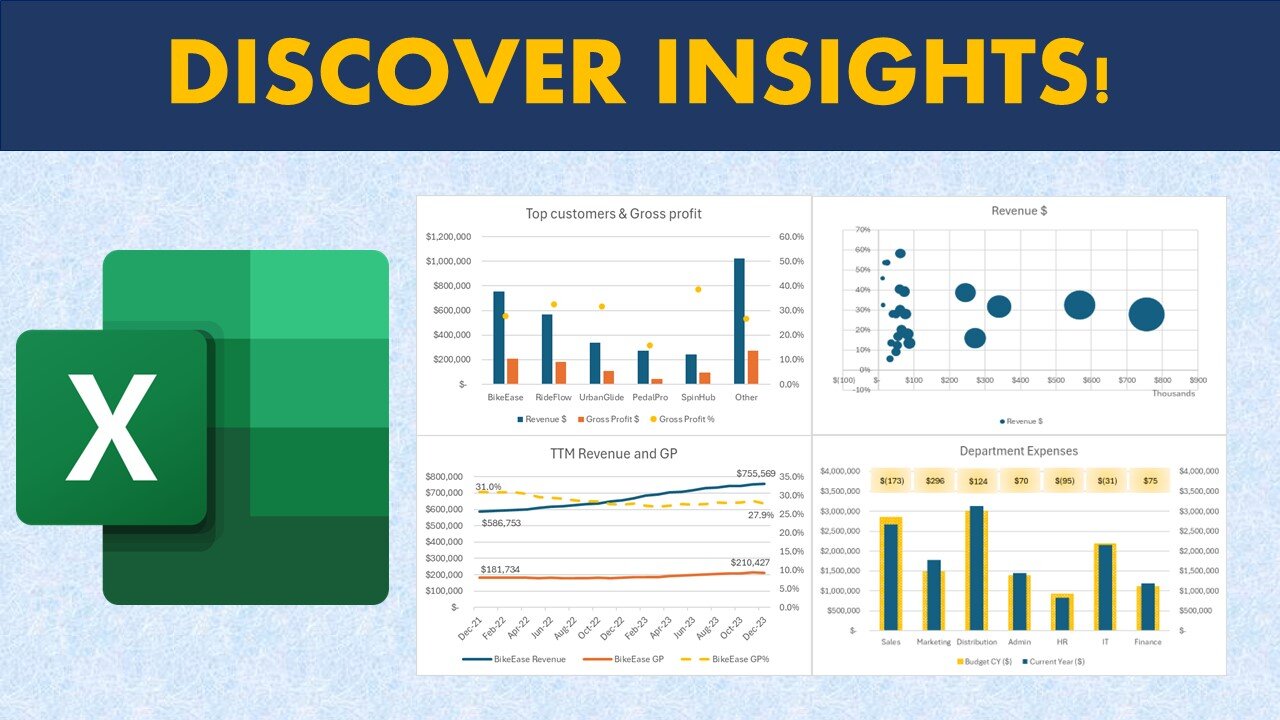
00:16 Chart visualization for Revenue and Gross profit including Profit Margin (%)
00:39 Bubble Chart for customer profitability analysis
01:01 Chart for Revenue and gross profit margin trend (Trend analysis)
01:54 Charts for Expenses vs budget analysis
02:13 Chart to highlight categories of spend vs budget
02:25 Forecast Chart
02:34 Chart for Outlier Analysis
02:54 Create Clustered column charts in Excel
04:17 Create Customer profitability Bubble charts in Excel
05:27 Create Trend Analysis (Line chart) in Excel
07:26 Budget vs Actual spend chart in Excel
09:23 Waterfall Chart for spend analysis in Excel
10:07 Create a forecast chart in Excel
11:36 Create scatter chart for sales commission analysis in Excel
📊 Unlock Financial Insights:
Discover the art of data visualization as we explore advanced techniques for financial analysis. Our step-by-step guide will empower you to go beyond traditional methods, allowing you to unlock valuable financial insights hidden within your datasets.
📈 Revenue and Gross Profit Analysis:
Learn how to conduct thorough revenue and gross profit analysis using dynamic Excel charts. Uncover trends, patterns, and key financial indicators to drive strategic decisions.
📉 Expenses vs Budget:
Navigate the complexities of budgeting and expenses with insightful graphs. We'll guide you through creating visual representations that simplify expense tracking and budget analysis.
🔄 Data Relationships and Forecasting:
Explore the world of data relationships and forecasting through Excel charts. Understand how to identify correlations, predict future trends, and make informed decisions based on your financial data.
🚀 Excel Tips & Techniques:
Whether you're a financial analyst, business professional, or Excel enthusiast, this tutorial is tailored for you. We'll showcase Excel tips and techniques that elevate your financial modeling, budgeting, and reporting skills to new heights.
💡 Tags:
Financial Analysis, Excel Charts, Data Visualization, Financial Modeling, Business Analytics, Excel Tips, Financial Insights, Data Analysis, Graphs Tutorial, Excel for Finance, Financial Reporting, Data Visualization Techniques, Financial Dashboards, Excel Graphing, Budgeting in Excel, Excel Techniques, Visual Data Analysis, Finance Tools, Excel Tutorial, Spreadsheet Analytics
-
 35:51
35:51
Athlete & Artist Show
1 day ago $6.58 earnedIs Ryan Smith The Best Owner In The NHL?
33.8K4 -
 22:56
22:56
American Thought Leaders
2 days agoCharles Murray: I Thought Religion Was Irrelevant to Me. I Was Wrong.
25.7K6 -
 36:22
36:22
Brad Owen Poker
6 hours agoGIGANTIC $17,000+ Pot In BOBBY’S ROOM! TRAPPING Top Pro w/FULL HOUSE!! Big Win! Poker Vlog Ep 326
30.8K -
 3:53
3:53
NAG Daily
23 hours agoRUMBLE RUNDOWN: DREAM HACK SPECIAL W/Greenman Reports
22.1K6 -
 1:28
1:28
Damon Imani
2 days agoThey Laughed at Trump’s Cognitive Test — Damon Made Them REGRET It!
32.4K11 -
 9:14
9:14
Freedom Frontline
1 day agoAdam Schiff PANICS As Eric Schmitt Exposes His Dirty Lies LIVE
21.4K35 -
 10:32
10:32
GBGunsRumble
1 day agoGBGuns Armory Ep 153 Adler Arms AD-9`
14.3K2 -
 35:53
35:53
Degenerate Plays
5 hours ago $0.37 earnedRuckus Randy And Repair Ronald (Socks On) - Call of Duty: Modern Warfare 2 (2009) : Part 7
9.25K1 -
 38:35
38:35
Stephen Gardner
1 day ago🔥What JUST leaked out of Congress. PROVES Trump RIGHT!!
102K141 -
 LIVE
LIVE
Total Horse Channel
17 hours ago2025 IRCHA Derby & Horse Show - November 2nd
51 watching