Excel Charts & Graphs for Advanced Financial analysis📈
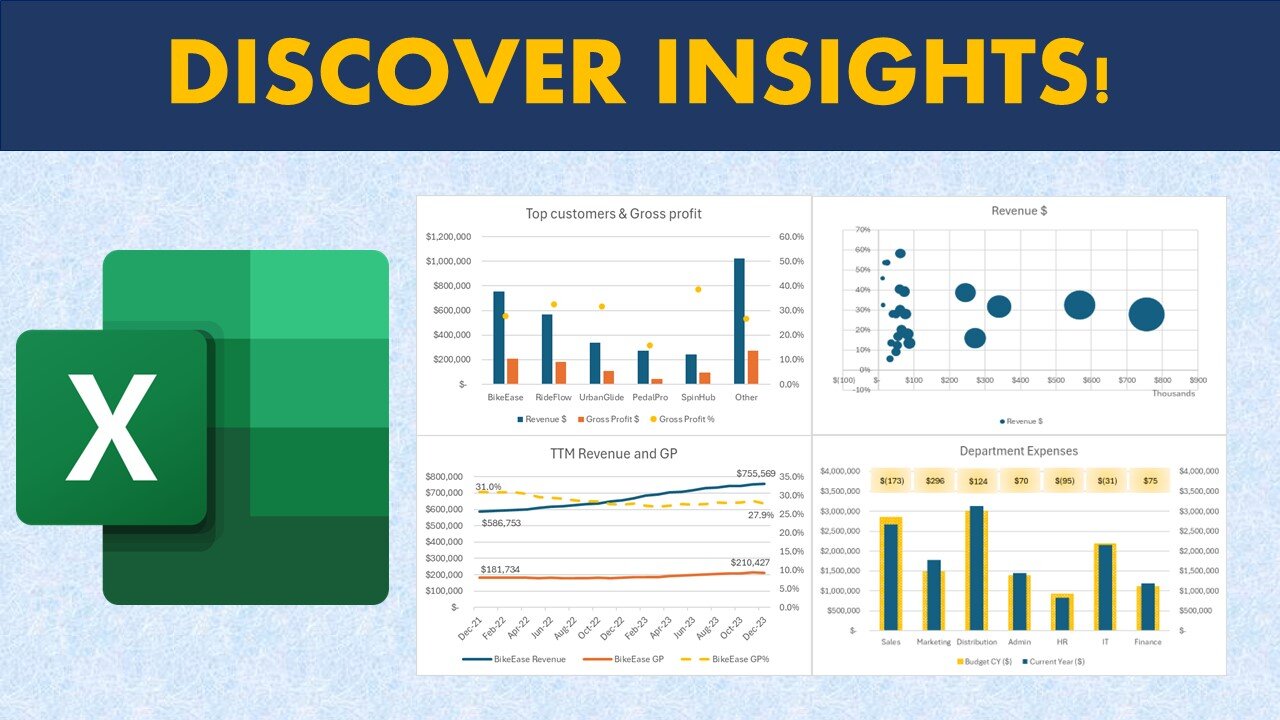
00:16 Chart visualization for Revenue and Gross profit including Profit Margin (%)
00:39 Bubble Chart for customer profitability analysis
01:01 Chart for Revenue and gross profit margin trend (Trend analysis)
01:54 Charts for Expenses vs budget analysis
02:13 Chart to highlight categories of spend vs budget
02:25 Forecast Chart
02:34 Chart for Outlier Analysis
02:54 Create Clustered column charts in Excel
04:17 Create Customer profitability Bubble charts in Excel
05:27 Create Trend Analysis (Line chart) in Excel
07:26 Budget vs Actual spend chart in Excel
09:23 Waterfall Chart for spend analysis in Excel
10:07 Create a forecast chart in Excel
11:36 Create scatter chart for sales commission analysis in Excel
📊 Unlock Financial Insights:
Discover the art of data visualization as we explore advanced techniques for financial analysis. Our step-by-step guide will empower you to go beyond traditional methods, allowing you to unlock valuable financial insights hidden within your datasets.
📈 Revenue and Gross Profit Analysis:
Learn how to conduct thorough revenue and gross profit analysis using dynamic Excel charts. Uncover trends, patterns, and key financial indicators to drive strategic decisions.
📉 Expenses vs Budget:
Navigate the complexities of budgeting and expenses with insightful graphs. We'll guide you through creating visual representations that simplify expense tracking and budget analysis.
🔄 Data Relationships and Forecasting:
Explore the world of data relationships and forecasting through Excel charts. Understand how to identify correlations, predict future trends, and make informed decisions based on your financial data.
🚀 Excel Tips & Techniques:
Whether you're a financial analyst, business professional, or Excel enthusiast, this tutorial is tailored for you. We'll showcase Excel tips and techniques that elevate your financial modeling, budgeting, and reporting skills to new heights.
💡 Tags:
Financial Analysis, Excel Charts, Data Visualization, Financial Modeling, Business Analytics, Excel Tips, Financial Insights, Data Analysis, Graphs Tutorial, Excel for Finance, Financial Reporting, Data Visualization Techniques, Financial Dashboards, Excel Graphing, Budgeting in Excel, Excel Techniques, Visual Data Analysis, Finance Tools, Excel Tutorial, Spreadsheet Analytics
-
 1:40:09
Dear America
3 hours agoBREAKING NEWS UPDATE! Dark Truth EXPOSED: Charlie Kirk's Assassin & the Trans Agenda-This Is WAR!
129K126 -
 LIVE
LIVE
Badlands Media
10 hours agoBadlands Daily: September 15, 2025
4,684 watching -
 LIVE
LIVE
The Big Mig™
2 hours agoUncaged Host w/ Controversial Patriot Ret. MLB Closer John Rocker
4,280 watching -
 LIVE
LIVE
Caleb Hammer
1 hour agoHe Needs To Divorce Her | Financial Audit
131 watching -
 LIVE
LIVE
Chad Prather
1 hour agoCharlie Kirk’s Impact Felt WORLDWIDE, Even At Coldplay Concert + Pastors SPEAK UP Across America!
597 watching -
 LIVE
LIVE
Wendy Bell Radio
6 hours agoWe Are Charlie.
8,082 watching -
 2:01:01
Matt Kohrs
11 hours agoTesla Stock Is SQUEEZING (Market Open Analysis) || Live Trading
40.6K5 -
 40:43
40:43
Randi Hipper
1 hour agoBIG WEEK FOR BITCOIN! LATEST PRICE UPDATE
33.5K -
 1:26:16
JULIE GREEN MINISTRIES
4 hours agoLIVE WITH JULIE
140K276 -
 3:43:42
The Pete Santilli Show
4 hours agoOur Memorial & Prayer Vigil For Charlie Kirk - September 15, 2025
46.3K1