Tutorial 211 | Create a rectangle between 2 times and the highest/lowest price between those times
11 months ago
2
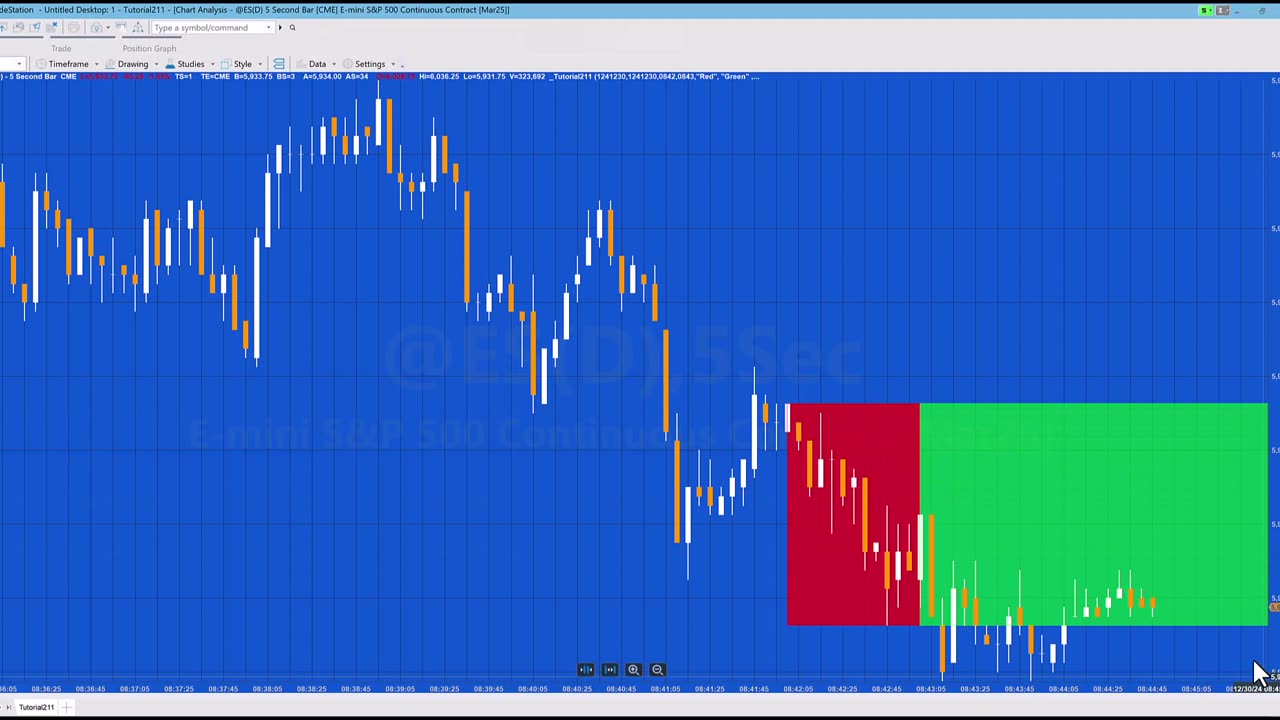
Tutorial 211 explains how to draw a rectangle on a chart between two times with the highs and lows set to be the highest high and the lowest low during the period between the two times. A second rectangle is drawn continuing the first rectangle to the end of the chart. The rectangles are drawn using a method.
The tutorial also shows how to convert dates and time to DateTime format and how to created DateTime points.
The tutorial program is able to draw rectangles for historical times that have already passed as well as future bars.
Loading comments...
-
 1:35:27
Inverted World Live
9 hours agoLost Satellites, Wild Horses, and 3i/Atlas
149K6 -
 2:53:42
TimcastIRL
8 hours agoCandace Owens IMPLODES, Audience IN REVOLT, Claim SHES A CLONE Or GOT THE CALL | Timcast IRL
289K216 -
 2:49:53
Barry Cunningham
8 hours agoLIVE BREAKING NEWS: President Trump Celebrates Hanukkah! And More News
68.2K12 -
 1:29:40
Anthony Rogers
15 hours agoEpisode 394 - Isaac Butterfield
34.2K1 -
 8:02
8:02
China Uncensored
14 hours agoChina Just Took The First Step Towards WAR
43.6K24 -
 1:20:04
Flyover Conservatives
1 day agoWhy Did Jesus Really Come? It’s NOT What You Think - Pedro Adao | FOC Show
39.9K4 -
 2:18:25
DLDAfterDark
6 hours ago $3.52 earnedYo Homie! Is That My Briefcase?? EDC & Gun Talk - Blue Waffle Giveaway Pre Stream
34.8K3 -
 1:34:23
Glenn Greenwald
10 hours agoSydney Shooting Exploited for Pro-Israel Censorship and Anti-Muslim Crackdowns; How Media DEI Was the Opposite of Diversity | SYSTEM UPDATE #559
144K133 -
 1:09:01
MattMorseTV
9 hours ago $55.54 earned🔴Trump just handed Congress THE EVIDENCE.🔴
60.3K123 -
 1:01:54
BonginoReport
10 hours agoVanity Fair Goes Nuclear On Trump’s Inner Circle - Nightly Scroll w/ Hayley Caronia (Ep.198)
156K75