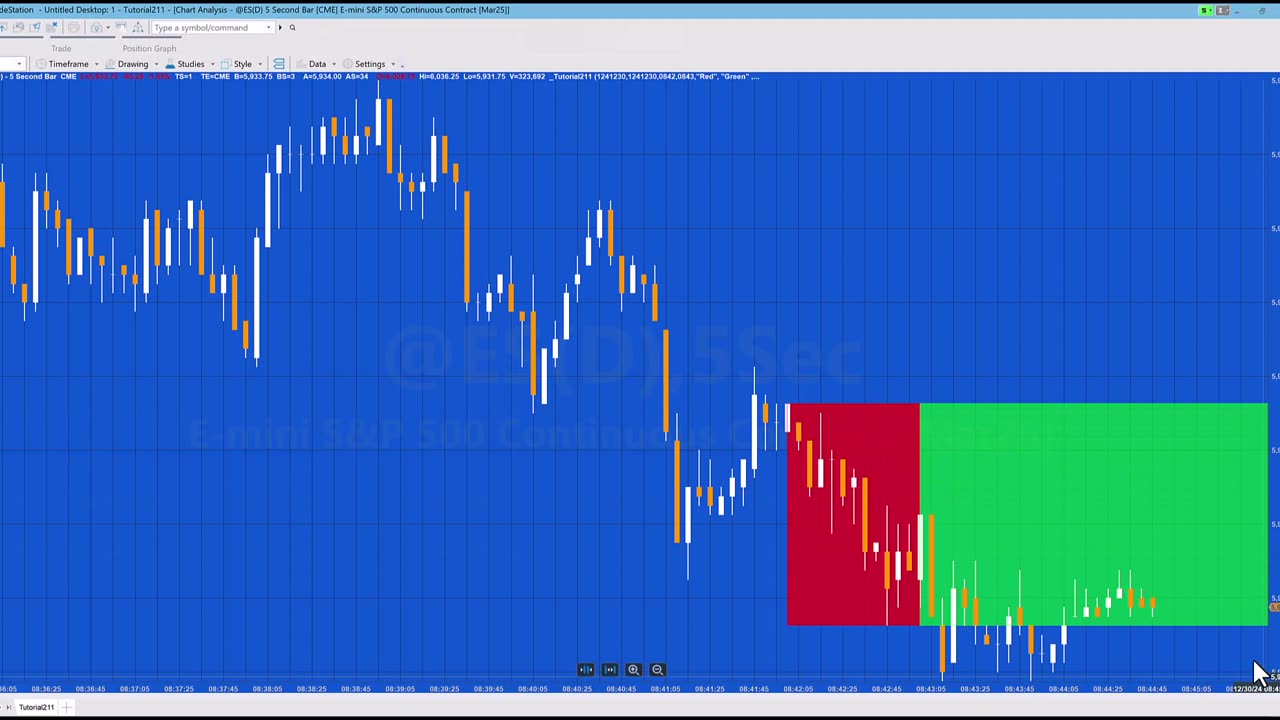
Tutorial 211 | Create a rectangle between 2 times and the highest/lowest price between those times
11 months ago
2
Tutorial 211 explains how to draw a rectangle on a chart between two times with the highs and lows set to be the highest high and the lowest low during the period between the two times. A second rectangle is drawn continuing the first rectangle to the end of the chart. The rectangles are drawn using a method.
The tutorial also shows how to convert dates and time to DateTime format and how to created DateTime points.
The tutorial program is able to draw rectangles for historical times that have already passed as well as future bars.
Loading comments...
-
 LIVE
LIVE
LFA TV
12 hours agoLIVE & BREAKING NEWS! | WEDNESDAY 12/17/25
2,199 watching -
 1:33:59
Game On!
18 hours ago $0.94 earnedBIGGEST 2025 College Football Playoff 1st Round BETS NOW!
21.6K2 -
 1:04:39
Crypto Power Hour
11 hours ago $4.69 earnedState of Early Stage Crypto Investor Rob Good
39.6K8 -
 1:24:24
LIVE WITH CHRIS'WORLD
18 hours agoTHE WAKE UP CALL - 12/17/2025 - Episode 27
20.9K -
 27:51
27:51
ThinkStory
19 hours agoIT: WELCOME TO DERRY Season 1 Ending Explained!
26.9K -
 5:29
5:29
Gamazda
13 hours ago $1.82 earnedMetallica - Nothing Else Matters (Live Piano in a Church)
19.2K7 -
 2:50:56
The Confessionals
21 hours agoHe Killed a Monster (Then They Told Him to Stay Silent)
14.2K9 -
 41:42
41:42
Brad Owen Poker
16 hours ago $0.78 earnedMy BIGGEST WIN EVER!! $50,000+ In DREAM Session!! Must See! BEST I’ve Ever Run! Poker Vlog Ep 360
15.6K1 -
 17:53
17:53
The Illusion of Consensus
20 hours ago $1.10 earnedWhat Women REALLY Want in Public (It’s Not What You Think) | Geoffrey Miller
17.6K7 -
 1:32:16
Uncommon Sense In Current Times
18 hours ago $0.54 earnedPolygyny Debate: The Biblical Case For and Against Plural Marriage | Uncommon Sense
13.9K1