Tutorial 211 | Create a rectangle between 2 times and the highest/lowest price between those times
11 months ago
2
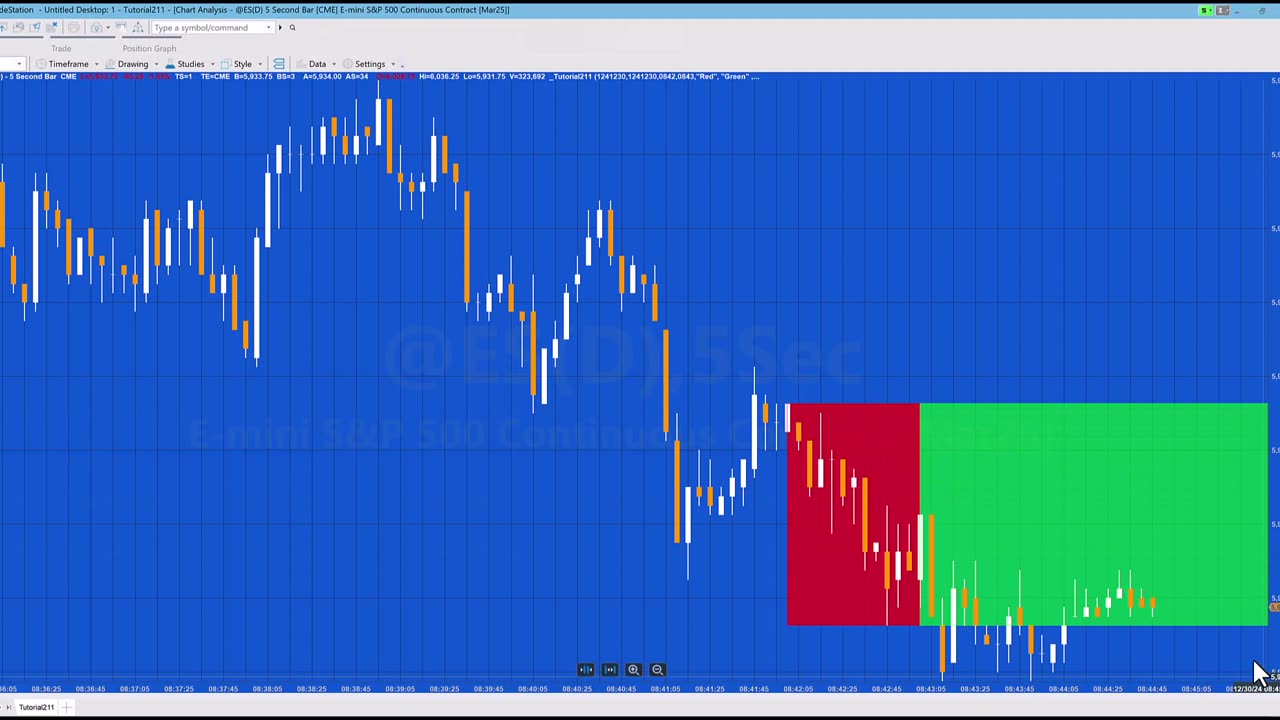
Tutorial 211 explains how to draw a rectangle on a chart between two times with the highs and lows set to be the highest high and the lowest low during the period between the two times. A second rectangle is drawn continuing the first rectangle to the end of the chart. The rectangles are drawn using a method.
The tutorial also shows how to convert dates and time to DateTime format and how to created DateTime points.
The tutorial program is able to draw rectangles for historical times that have already passed as well as future bars.
Loading comments...
-
 LIVE
LIVE
The Illusion of Consensus
42 minutes agoYou’re Healing The Wrong Way - Meditation, Trauma & Awakening EXPLAINED | Loch Kelly
64 watching -
 1:17:06
The Rubin Report
3 hours agoLeftist Insults Jillian Michaels on Piers Morgan & It Gets Brutal Fast
41.7K18 -
 LIVE
LIVE
Sean Unpaved
2 hours agoMike McDaniel & Dolphins BENCH Tua Tagovailoa For Quinn Ewers! | UNPAVED
126 watching -
 3:12:33
Misfits Mania
17 hours ago $26.43 earnedANDREW TATE VS CHASE DEMOOR OFFICIAL OPEN WORKOUT
196K23 -
 LIVE
LIVE
LFA TV
17 hours agoLIVE & BREAKING NEWS! | WEDNESDAY 12/17/25
2,148 watching -
 LIVE
LIVE
SternAmerican
1 day agoFINAL ELECTION INTEGRITY CALL OF 2025 – WEDNESDAY, DECEMBER 17 | 1:00 PM EST
217 watching -
 1:04:41
MYLUNCHBREAK CHANNEL PAGE
4 hours agoA.I. Destroys History
16.4K10 -
 1:48:47
The Mel K Show
3 hours agoMORNINGS WITH MEL K- Confronting Inverted Truth & Suicidal Empathy - 12-17-25
19.6K7 -
 LIVE
LIVE
The Shannon Joy Show
3 hours agoSJ LIVE Dec 17 - The Latest On #RealityDC: Queen Susie Takes Her Throne. Move Over Trump, There’s A New Sheriff In Town! With Special Guest - Independent Political Analyst Carey Wedler!
115 watching -

Badlands Media
11 hours agoBreaking History Ep. 129
22.5K7