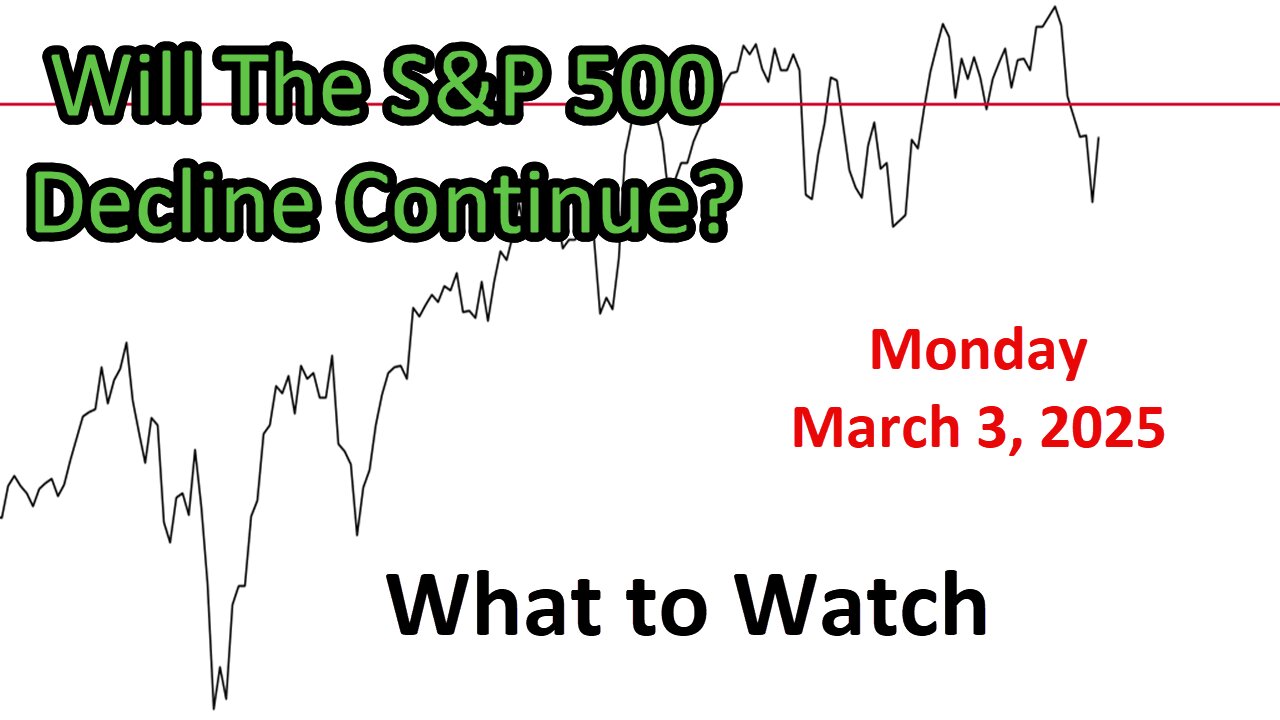
S&P 500 What to Watch for Monday March 3, 2025
Link to The SPX Investing Program https://spxinvesting.substack.com/
Link to The SPX Investing Program Overview Video: https://youtu.be/rkvOOZxMW00?si=FPT-g7SXzPo-MdW8
Summary of the What to Watch Update prepared for Monday, March 3rd, 2025:
This newsletter analyzes current market trends, focusing on the S&P 500, and is divided into three sections: positive indicators, negative indicators, and areas to watch.
Positive Indicators:
The S&P 500's advance-decline line is holding up well, showing a rotation from offensive to defensive sectors rather than money exiting the market.
Advancers minus decliners over a 10-day period remains positive, and new highs minus new lows show more green than red.
Smart Money Indicator #1, Accumulation/Distribution (price and volume-based) is positive, bouncing back above its moving average on Friday.
Short-term and intermediate-term advance-decline ratios are above zero, and the McClellan Oscillator for the S&P 500 crossed back above zero.
Stocks above their 20-period moving averages crossed above 50, showing short-term resilience.
Large caps are outperforming small caps, and the financial sector is strong, supporting the broader market.
Long-term trends, like the weekly Parabolic SAR and NASDAQ 100 ratios, remain positive.
Negative Indicators:
The Intraday chart shows late-day weakness, especially on Thursday, with smart money driving prices lower. However, the decline was recovered on Friday.
Sentiment is negative, with pessimism in surveys (e.g., AAII) and the VIX spiking above 20 (though it eased below 20 on Friday).
Risk-on vs. risk-off ratios are declining, and growth-to-value ratios are weakening across large, mid, and small caps.
Discretionary-to-staples ratios are dropping as the market shifts to a defensive posture.
Momentum is negative across short, intermediate, and long-term oscillators, with the Vortex Indicator and daily Parabolic SAR turning bearish.
The Broad Market indices (e.g., Wilshire 5000, NASDAQ 100, small caps) are below key moving averages, and semiconductors are weakening.
Smart Money Indicators #2 (Chaiken Money Flow) and #3 (Chaiken Oscillator) are negative, showing declining money flow and failure to cross above key averages.
Areas to Watch:
The S&P 500 has declined over 5% from its recent high, but not yet 10%, where buying has historically stepped in.
Jobless claims are rising, but continuing claims are declining; the upcoming employment report on Friday will be key.
The VIX variation suggests a big move is anticipated, though direction is unclear.
Interest rate and inflation concerns are reflected in TIPS and bond ratios, with mixed signals.
Japan’s 10-year yield is rising, and the U.S. 10-to-2 yield curve is normalizing while the 10-to-3-month curve has inverted again, raising economic concerns.
Oil prices are dropping below $70, signaling weak demand, and the dollar is rising and remains in an uptrend.
Conclusion:
Will the S&P 500 decline continue? Currently, there is a mixed picture: internals like the advance-decline line and short-term moving averages show resilience, but negative momentum, sentiment, and sector shifts suggest caution. The market is at a tug-of-war between offense and defense, with key levels (e.g., 10% pullback, 200-day moving averages) and economic data (e.g., employment report) critical factors to monitor.
DISCLAIMER This video is for entertainment purposes only. I am not a financial adviser, and you should do your own research and go through your own thought process before investing in a position. Trading is risky.
-
 44:09
44:09
The SPX Investing Program
4 days agoS&P 500 Daily Update for Monday October 6, 2025
421 -
 1:28:11
Sean Unpaved
3 hours agoSnap Counts & Showdowns: Hunter's Usage, CFB Fire, & Playoff Baseball Bonanza
62.1K1 -
 56:09
56:09
Steven Crowder
5 hours agoBlack Fatigue is Real and I Told Them Why | Black & White on the Gray Issues
294K1.19K -
 3:52
3:52
Michael Heaver
2 hours agoItaly Issues Bombshell Ban ALERT
25 -
 1:10:24
Simply Bitcoin
3 hours ago $1.46 earnedLEAKED CONVERSATION: US SECRET Bitcoin Plan EXPOSED?! | EP 1350
7.42K3 -
 3:36:42
Barry Cunningham
15 hours agoBREAKING NEWS: PRESIDENT TRUMP HOSTS FULL CABINET MEETING!
25.5K10 -
 1:59:05
The Charlie Kirk Show
3 hours agoTurning Point Halftime + Antifa Panel Aftermath + Right-Wing Taylor Swift? |Patrick, Cuomo|10.9.2025
61.8K31 -
 27:46
27:46
Jasmin Laine
3 hours agoCBC TURNS On Carney After Trump HUMILIATES Him–Poilievre’s Response Goes Viral
5.62K12 -
 4:27:44
Right Side Broadcasting Network
7 hours agoLIVE REPLAY: President Trump Hosts a Cabinet Meeting - 10/9/25
110K49 -
 1:13:52
Mark Kaye
3 hours ago🔴 Schumer BUSTED Celebrating Democrat Shutdown!
16.4K6