Premium Only Content

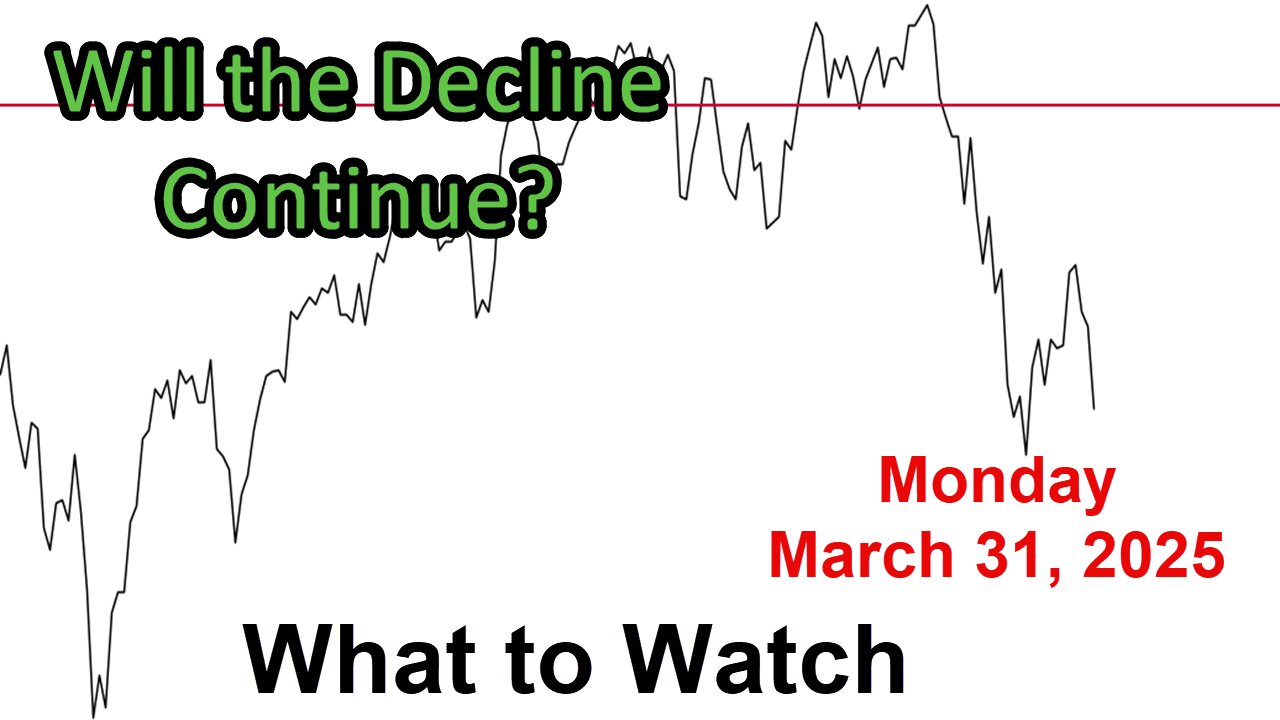
What to Watch for Monday March 31, 2025
Link to The SPX Investing Program https://spxinvesting.substack.com/
Summary of the What to Watch for Monday, March 31, 2025:
This update, prepared over the weekend, analyzes market charts to identify positive, negative, and neutral trends following a significant downturn on Friday. The S&P 500 has returned to a previously tested support level, raising questions about whether the bottom is in or if a further decline is imminent.
Positive Indicators:
The advance-decline line is holding up, suggesting rotation within the market rather than an exodus of capital.
The 10-day advancers-decliners oscillator remains above zero despite Friday's drop.
New 52-week highs outnumber lows, indicating some resilience, possibly due to rotation into value stocks.
The VIX momentum is still positive (trending lower), though it’s showing signs of turning up.
Accumulation-distribution and the short-term oscillators remain above key thresholds, staying positive despite the hit.
The S&P 500 closed just above its long-term pivot point (5577) at 5581, and long-term support is holding on the weekly chart.
The NASDAQ 100 momentum and its ratio to small caps (IWM) remain positive, though showing signs of weakening.
Negative Indicators:
Friday’s sell-off, triggered by rounded-up Core PCE data and poor consumer sentiment, pushed the S&P 500 to the S3 pivot point.
Short-term, intermediate, and weekly trends (via ADX) are negative, with the short-term trend weakening but still active.
The market broke below key moving averages (20, 50, 200-day), including a significant anchored moving average from April 2024.
Growth-to-value ratios across large, mid, and small caps are declining, signaling a shift to defensive sectors.
Discretionary-to-staples and risk-on-to-risk-off ratios dropped sharply, reflecting market caution.
The VIX rose above 20, and advance-decline lines fell below shorter-term moving averages.
The Smart Money Indicators, Bullish Percent Indexes, and the Summation Indexes turned negative after Friday.
The Semiconductors and tech sectors show death crosses, and consumer sentiment is declining amid uncertainty about the new administration’s policies.
Areas to Watch:
Volume remains below average, indicating a lack of conviction.
The S&P 500 is nearing a 10% correction from its February high, testing a prior low.
Employment data (weekly jobless claims and the April 4th report) will be critical for recession signals.
The Pring Bottom Fisher issued a buy signal, but confirmation from other indicators is needed.
Interest rates are stable below 4.5%, while bond market spreads and ratios (e.g., TIPS, cash vs. bonds) show mixed inflation signals.
Oil is below $70, and the dollar is under its 200-day moving average.
The market appears vulnerable, with more negative than positive signals after Friday’s damage. Rotation into value and defensive sectors is persisting and broader trends suggest caution. Key employment data and technical levels will be pivotal in determining the next move.
PDF of Charts and Slides used in today's video:
https://drive.google.com/file/d/15EdKfoHaYQ4hmOGoyG2IfBbcozZoI8qf/view?usp=sharing
My Exclusive Free Workshop: The Four P's of Building a Successful Investing Program → https://spxinvesting.mailchimpsites.com
Facebook Private Group:
https://www.facebook.com/groups/667271964721864
DISCLAIMER This video is for entertainment purposes only. I am not a financial adviser, and you should do your own research and go through your own thought process before investing in a position. Trading is risky!
-
 38:52
38:52
The SPX Investing Program
3 days agoS&P 500 Daily Update for Thursday September 25, 2025
23 -
 LIVE
LIVE
Benny Johnson
1 hour agoChristianity Under Attack: Trump Declares 'Epidemic of Violence' on Christians As Church Shot,Burned
5,638 watching -
 1:00:21
VINCE
2 hours agoThe Left's "Mostly Peaceful" Terrorists + Guest Eric Trump | Episode 135 - 09/29/25
173K79 -
 LIVE
LIVE
LFA TV
14 hours agoBREAKING NEWS ALL DAY! | MONDAY 9/29/25
4,635 watching -
 LIVE
LIVE
The Big Mig™
2 hours agoPesticides & Herbicides, The Ugly Truth w/ Zen Honeycutt
4,753 watching -
 LIVE
LIVE
Bannons War Room
7 months agoWarRoom Live
14,213 watching -
 LIVE
LIVE
LadyDesireeMusic
59 minutes agoLive Piano & Convo | Support a Culture Change | Make Ladies Great Again
124 watching -
 35:58
35:58
Mike Rowe
3 days agoWhat About Jimmy Kimmel? | Hot Takes
19.5K36 -
 LIVE
LIVE
LumpyPotatoX2
2 hours agoDestiny Rising: Gameplay + Industry Talks - #RumbleGaming
38 watching -
 LIVE
LIVE
Badlands Media
9 hours agoBadlands Daily: September 29, 2025
4,183 watching