Federal Spending Odds & Ends: Interest Payments/Transfer Payments to Individuals

Lyin' Brian Tyler Cohen is really worried about Medicaid spending

Federal Spending Odds & Ends (Defense, Entitlements, Foreign Aid) #DOGE

Mariannette Miller-Meeks triggers mentally ill Iowa City Democrats #DOGE
Tell your Democrat friends: Take the Bernie Sanders Tax Hike Challenge

So, You're Nostalgic for the 1950s?
So you’re Nostalgic for the 1950s? Part II

Senator Rand Paul raises the alarm on our coming fiscal calamity

Senator Rand Paul on foreign aid
Federal Spending Odds & Ends (Defense, Entitlements, Foreign Aid) #DOGE
Federal Spending Odds & Ends (Defense, Entitlements, Foreign Aid) #DOGE
DOGE you know how to cut federal spending?
Federal Spending data https://web.archive.org/web/20240705083452/https://www.whitehouse.gov/omb/budget/historical-tables/ https://web.archive.org/web/20241130122049/https://www.whitehouse.gov/wp-content/uploads/2024/03/hist_fy2025.zip https://web.archive.org/web/20241228032104/https://www.whitehouse.gov/wp-content/uploads/2024/03/hist08z3_fy2025.xlsx https://web.archive.org/web/20241229072453/https://www.whitehouse.gov/wp-content/uploads/2024/03/hist08z8_fy2025.xlsx https://web.archive.org/web/20241208132545/https://www.whitehouse.gov/wp-content/uploads/2024/03/hist08z2_fy2025.xlsx
*** U.S. Population Data https://www.census.gov/data/datasets/time-series/demo/popest/2020s-counties-total.html https://www.census.gov/data/datasets/time-series/demo/popest/2010s-counties-total.html https://www2.census.gov/library/publications/2011/compendia/statab/131ed/2012-statab.pdf ***
In this edition I’m going to cover Defense Spending, Medicare & Social Security spending
Let’s go to Table 8.3 first & tally what % of all federal outlays (if you want to see how much federal outlays have grown adjusted for inflation & other data, see https://rumble.com/playlists/IIv11M6lVOE) are “National Defense.”
FY 1970-2023 average = 21.414% * FY 1982-89 average = 26.75% * FY 1994-2001 = 17.1% * FY 2002-09 = 19.35% * FY 2010-17 = 17.4% * FY 2018-2023 = 12.883%
You can see how it plummeted relative to the Ronald Reagan era & if you followed my series on this, you know that before I posted it. That doesn’t mean there isn’t substantial waste at the Pentagon. I’d wager there are a lot of redundancies & a lot of paper-pushers that are unnecessary, it just means spending on “National Defense” is NOT growing as fast as the budget en masse. I would also negate ALL foreign aid, as Ron Paul has wanted to do since… forever.
How about Social Security & Medicare spending combined as a percentage of the entire budget (Table 8.3)? FY 1970-2023 average = 30.132% * FY 1982-89 average = 27.112% * FY 1994-01 average = 33.424% * FY 2002-09 = 33.162% * FY 2010-17 average = 36.7% * FY 2018-23 average = 32.966%
I tallied them together, but if you do this yourself, you’ll see that Medicare is catching-up w/ Social Security as a % of all spending. The only reason those programs collectively fell from FY 2018-23, relative to Barack Obama (FY2010-17) was the growth in “other means-tested entitlements” & other federal giveaways that began during the COVID-19 plandemic in FY 2020.
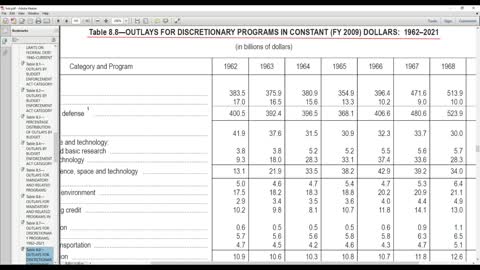
Not turn to Table 8.8 & we will tally “Total National Defense” (“DoD-Military (051)” and “Other Defense”) outlays, adjusted for inflation.
FY 1970-2023 average = $533.51 Billion * FY 1982-89 average = $547.737 Billion * FY 1994-2001 average = $455.287 * FY 2002-09 average = $614.287 Billion * FY 2010-17 average = $654.312 Billion * FY 2018-23 average = $654.966 Billion
See how it declined under Bill Clinton (FY 1994-01) & then exploded again? However, those who say defense spending has done nothing but grow (relative to inflation) & insinuate it’s the biggest part of the budget are mistaken. I’ll be generous & say they’re retarded.
Let’s look at “National Defense” spending per capita, FY 2000-2023 (Table 8.2, adjusted for inflation).
[NOTE: Table 8.2 & Table 8.8 have the same data, just broken down differently]
FY 2000-23 average = (7,473,134,960 population & $14,986,500,000,000 spending) $2,005.38 per capita.
FY 2002-09 average = (2,378,484,000 population & $4,914,300,000,000 spending) $2,066.14 per capita
FY 2010-17 average = (2,536,990,138 population & $5,234,500,000,000) $2,063.27 per capita
FY 2018-2023 average = (1,986,627,255 population & $3,929,800,000,000) $1,978.12 per capita.
Well golly gee, I thought the Pentagon was the only portion of the federal budget rising faster than inflation & everything else was falling. I thought Medicaid was being eradicated, along w/ our generous (and ineffective) welfare state. Well, I guess that’s not true. It’s akin to polls taken during the early 2000s & years following – the plebs usually thought crime was rising, but that’s not true. Perception does not equal reality.
U.S. Population 2000 = 282,172,000 * 2001 = 285,082,000 * 2002 = 287,804,000 * 2003 = 290,326,000 * 2004 = 293,046,000 * 2005 = 295,753,000 * 2006 = 298,593,000 * 2007 = 301,580,000 * 2008 = 304,375,000 * 2009 = 307,007,000 * 2010 = 308,745,538 * 2011 = 311,556,874 * 2012 = 313,830,990 * 2013 = 315,993,715 * 2014 = 318,301,008 * 2015 = 320,635,163 * 2016 = 322,941,311 * 2017 = 324,985,539 * 2018 = 326,687,501 * 2019 = 328,239,523 * 2020 = 331,464,948 * 2021 = 332,048,977 * 2022 = 333,271,411 * 2023 = 334,914,895 * Grand Total = 7,473,134,960
Let’s tally Social Security & Medicare spending per capita (Table 8.2), 2000-2023 & see what we find, eh?
FY 2000-2023 average (7,473,134,960 population & $31,155,900,000,000 spending) = $4,169.05 per capita. Oh noes, that’s >200% higher than the Pentagon, how can that be?
FY 2002-09 average (2,378,484,000 population & $8,223,200,000,000 spending) = $3,457.32 per capita
FY 2010-17 average (2,536,990,138 population & $11,122,100,000,000 spending) = $4,383.97 per capita
FY 2018-2023 average (1,986,627,255 population & $10,150,000,000,000 spending) = $5,109.16 per capita. Who’d thunk it? Social Security & Medicare, combined with Medicaid & “Other Means Tested Entitlements” are roughly 53% of the entire federal budget by themselves.
But “we don’t take care of people; we just build missiles.” Yes, there is waste at the Pentagon & our Founders were not fans of a standing army (our Navy needs to be robust enough to make 99% of evil actors say, “we don’t want any trouble”), but to say we spend the bulk of our taxpayer money on the Pentagon is beyond insane. It comes from people who just read headlines & never actually look. Shut off MSLSD & read something. Take your Ritalin too!
Since I’m going to debunk some anti-Semites in the near future (I’m with Ron Paul, ALL foreign aid should be axed. It’s one of the main reasons I voted for him in the 2012 Iowa Caucus – there are a lot of screeching banshees who can’t name any foreign aid recipients, except for Israel), let’s take a gander at spending on “International Affairs.” I will be utilizing Table 8.8 for this.
[NOTE: Table 3.2 is NOT adjusted for inflation but will give you an idea as to what encompasses foreign aid/international affairs. In addition, Table 3.2 adjusts the total by subtracting “International Financial Programs” receipts, I will just include the totals in Table 8.8 for this exercise]
International Affairs FY 1970-2023 average yearly spending, adjusted for inflation = $40.115 BILLION
International Affairs FY 2000-23 average yearly spending, adjusted for inflation = $48.508 BILLION
International Affairs FY 2010-17 average yearly spending, adjusted for inflation = $51 BILLION
International Affairs FY 2018-23 average yearly spending, adjusted for inflation = $56.683 BILLION
Now let’s see that per capita, shall we? We’re still on Table 8.8 kids.
International Affairs spending per capita, adjusted for inflation FY 2000-2023 (7,473,134,960 population & $1,164,200,000,000 spending) = $155.78 per capita
International Affairs spending per capita, adjusted for inflation FY 2002-09 (2,378,484,000 population & $350,300,000,000 spending) = $147.27 per capita
International Affairs spending per capita, adjusted for inflation FY 2010-2017 (2,536,990,138 population & $408,000,000,000 spending) = $160.82 per capita
International Affairs spending per capita, adjusted for inflation FY 2018-2023 (1,986,627,255 population & $340,100,000,000 spending) = $171.19 per capita
Not a big chunk of the budget & whatever direct foreign aid to Israel in the form of munitions, etc. is a tiny portion of that (but when you’re mentally ill, Israel is the hammer & everything looks like a nail) just so you know.
However, as I said earlier, there are a bevy of “it’s not much of the federal budget” programs that have gotten us into this mess. Do you want the dollar to collapse? Do you want to travel to the store & find empty shelves, as happened in the Soviet Union & Yugoslavia, two entities that no longer exist?
If not, then write to your elected officials NOW if you haven’t & tell them you support #DOGE finding this waste & Congressional rescission packages to end this. There’s a lot of low-hanging fruit (no offence intended Sam Seder) & a lot of unconstitutional spending that needs to end now. Do you want your grandchildren to experience an economic collapse? Me neither.
In my (hopefully? Maybe?) final video in this Federal Spending #DOGE series, I’m going to look at another economic harbinger – interest payments on the debt.
If you find this worthy, pass it on! Mr. Chairman, I Yield Back!
Here are the two votes Senator Rand Paul was talking about https://www.senate.gov/legislative/LIS/roll_call_votes/vote1191/vote_119_1_00132.htm https://www.senate.gov/legislative/LIS/roll_call_votes/vote1191/vote_119_1_00077.htm see how your Senators voted
I think it's time Chuck Grassley retired
-
 1:22:20
Steven Crowder
4 hours agoIt's Time to Annex Canada
271K191 -
 LIVE
LIVE
Viss
2 hours ago🔴(LIVE) - I’m Stockpiling Everything… (You’ll See Why) | Arc Raiders LIVE
173 watching -
 LIVE
LIVE
Wendy Bell Radio
7 hours agoIt's Time.
6,268 watching -
 LIVE
LIVE
ZWOGs
2 hours ago🔴LIVE IN 1440p! - FIRST TIME PLAYING HYTALE!!! I'm so excited!! - Come Hang Out!
64 watching -
 44:24
44:24
The Rubin Report
3 hours agoListen to Room Go Quiet as Rubio Says the Ugly Truth About Iran
46K11 -
 LIVE
LIVE
The Shannon Joy Show
1 hour ago🔥SJ LIVE Jan 16 - Friday Midday Matinee With Shannon Joy! Featuring “Conspiracy Theory”🔥
53 watching -
 LIVE
LIVE
LFA TV
16 hours agoLIVE & BREAKING NEWS! | FRIDAY 1/16/26
2,701 watching -
 1:52:02
The Mel K Show
2 hours agoMORNINGS WITH MEL K Manufactured Chaos & The Battle for Your Brain - 1-16-26
15.4K1 -
 1:01:31
BonginoReport
5 hours agoWho is Behind the Assaults on ICE? | Episode 205 - 01/16/26 VINCE
199K146 -
 1:36:46
Graham Allen
5 hours agoTERRORISM IN AMERICA | Trump’s Presidency May Hinge on the Insurrection Act
163K527