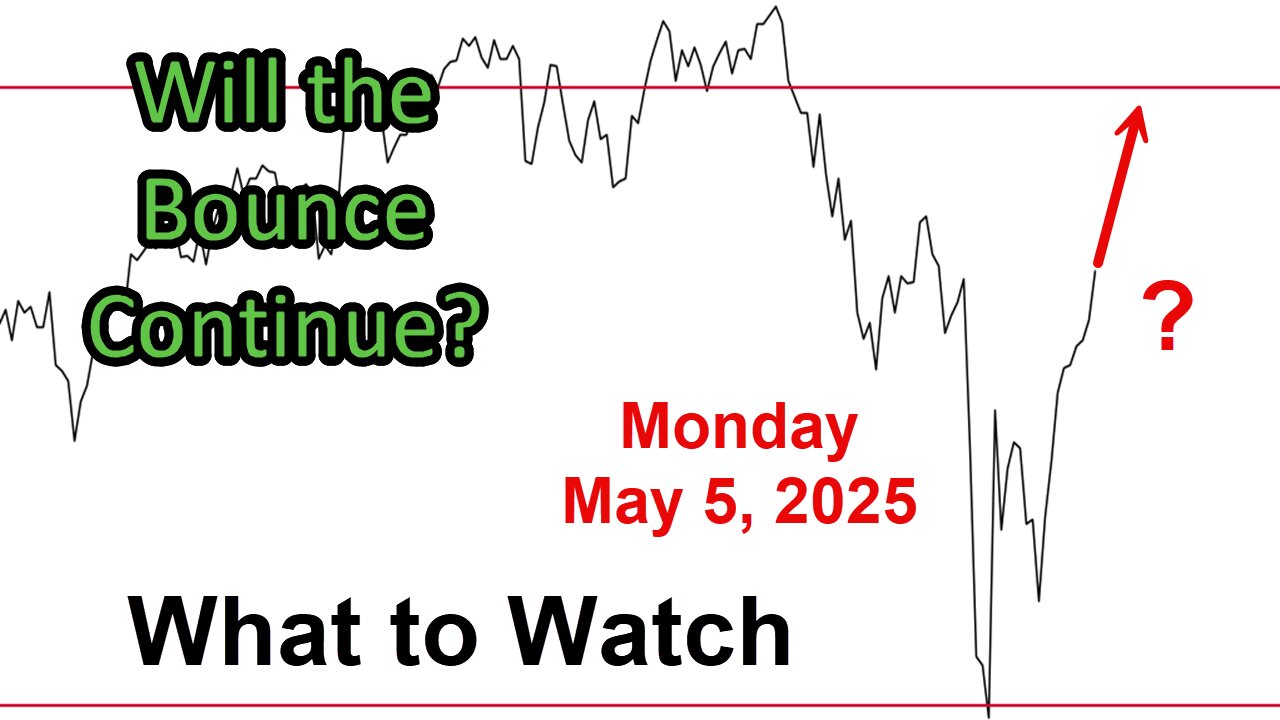
What to Watch Update for Monday May 5, 2025
Link to The SPX Investing Program https://spxinvesting.substack.com
What to Watch Update, prepared for May 5, 2025, analyzes market charts, mainly focused on the S&P 500, and categorizes them into positive, negative, and areas to watch due to uncertainty. Here's a summary:
Positive Areas
Market Recovery: After a weak GDP report and initial higher inflation data on Wednesday before the Open, the S&P 500 gapped lower but rebounded after the Core PCE report was released. The week closed near the psychological 5,700 level, which is becoming a technical level.
Sentiment Improvement: Sentiment is improving, moving above 25, though still below 50. This is seen as a contrarian indicator when extreme, but the trend is positive.
S&P 500 Trend Indicators:
Short-term ADX shows a positive crossover, indicating a potential strengthening trend if it continues above the moving average.
Intermediate-term ADX is above 20, with the green line slightly above the red, signaling a positive but weakening trend.
Growth vs. Value: Growth is outperforming value across large, mid, and small caps, with intraday charts showing positive trends, though small caps and mid-caps have struggled in 2025.
S&P 500 Internals:
High beta to low beta ratio is improving, indicating risk-on behavior.
Stocks above their 20-period moving averages are at 86.6%, signaling short-term strength but potential exhaustion.
The Advance-decline line and new highs/lows are improving, with fewer new lows and some new highs emerging.
Smart Money Indicators: Mixed. Accumulation/Distribution & the Chaiken Money Flow positive, while the Chaiken Oscillator is negative, and declined on an up day, a warning sign.
The Landry Light is turning positive.
Technical Levels: The S&P 500 is above a key pivot point on the weekly chart (e.g., 5575) and out of correction territory (down less than 10%).
Long-Term Trends: The S&P 500 remains above a long-term trend line from the 1987 crash and a 50-month moving average, signaling long-term positivity.
Other Markets: Indices such as the Dow, NASDAQ 100, and small caps are hitting resistance at their 50-day moving averages.
Negative Areas
Sentiment: Investors Intelligence and individual investor sentiment both remain extremely negative, a contrarian signal that hasn’t yet reversed despite recent market gains.
VIX: Still above 20, indicating negative annualized returns, though declining momentum is encouraging.
Volume: The recent uptrend lacks volume conviction for the S&P 500, showing a negative divergence compared to higher volume during declines.
Moving Averages: The S&P 500 is 1.03% below its 200-day moving average, which may act as resistance if reached.
Smart Money: The Chaiken Oscillator turned negative on Friday despite an up day, signaling caution.
Fibonacci Resistance: The S&P 500 hit the 61.8% retracement level (from April 2024 low to February 2025 high) but failed to close above it, aligning with resistance in other indices (Dow, NASDAQ 100, small caps).
Sector Weakness:
Semiconductors are underperforming, with the semi-to-Dow ratio declining.
Discretionary to staples and other defensive ratios are improving but remain in downtrends.
Long-Term Concerns: The SPY-to-staples ratio shows deterioration similar to late 2021, reminiscent of pre-2022 bear market condition, though it’s improving slightly.
Bonds and Homebuilders: Bonds (3-7 year) are outperforming stocks, and homebuilders show a negative divergence with the S&P 500, signaling potential economic weakness.
Areas to Watch
Employment Data: Jobless claims and continuing claims are spiking but remain in a range. A breakout higher could signal recession risks, while Friday’s stronger-than-expected employment report was positive.
Mass Index: A reversal signal was triggered, suggesting a potential downturn, though its relevance is questionable.
Interest Rates: The 10-year yield rose after the employment report, but the bond market isn’t overly concerned about inflation (based on T-bill to bond ratios). The 10-to-3-month yield curve is even, which could signal recession risks if it normalizes.
Context
The S&P 500 had a strong week, with nine consecutive up days for the S&P, but faces resistance at key technical levels (200-day moving averages, Fibonacci retracements). Positive & improving internals and growth outperformance are encouraging, but negative sentiment, weak volume, and sector underperformance (e.g., semiconductors) suggest caution. Economic indicators such as employment and interest rates remain critical for assessing recession risks.
PDF of Charts and Slides used in today's video: https://drive.google.com/file/d/1uGAcOLtF17-tF3ChoG7NWH0pnO5mA8h7/view?usp=sharing
DISCLAIMER This video is for entertainment purposes only. I am not a financial adviser, and you should do your own research and go through your own thought process before investing in a position. Trading is risky!
-
 4:04
4:04
The SPX Investing Program
20 hours agoDaily Update Podcast for Thursday September 25, 2025
16 -
 7:53
7:53
Rethinking the Dollar
11 hours agoForget AI & War: This Is What Will Break You in 2026
2.28K2 -
 20:03
20:03
Bearing
7 days agoGIRLFRIEND Reveals Her SECRET KINK 😂 (It Doesn’t Go Well) 💥
8.31K84 -
 56:23
56:23
Coin Stories with Natalie Brunell
1 day agoLyn Alden: Bullish on Bitcoin & Hard Assets
4.44K -
 8:10
8:10
MattMorseTV
17 hours ago $14.20 earnedSchumer's PLAN just IMPLODED.
25.9K62 -
 2:11:52
Side Scrollers Podcast
19 hours agoYouTube ADMITS BLATANT Censorship + California Wants to FINE “Hate Speech” + More | Side Scrollers
77.1K15 -
 15:18
15:18
GritsGG
15 hours agoSweaty Quads w/ Bobby Poff!
18.5K5 -
 17:11
17:11
Nikko Ortiz
1 day agoIs Poverty Your Fault?
39.7K37 -
 1:25:15
The HotSeat
1 day agoIn Less Than Two Weeks, Here We Are Again.....
24.2K17 -
 12:55
12:55
The Pascal Show
14 hours ago $3.83 earned'THAT'S HIS GIRLFRIEND!' D4vd's Friends Speak Out Revealing They Thought Celeste Was His Girlfriend!
15K3