Create cohort analysis chart 📊 using Python 🐍
🔥 Python Cohort Analysis Tutorial | Data Visualization Guide (Step by Step)
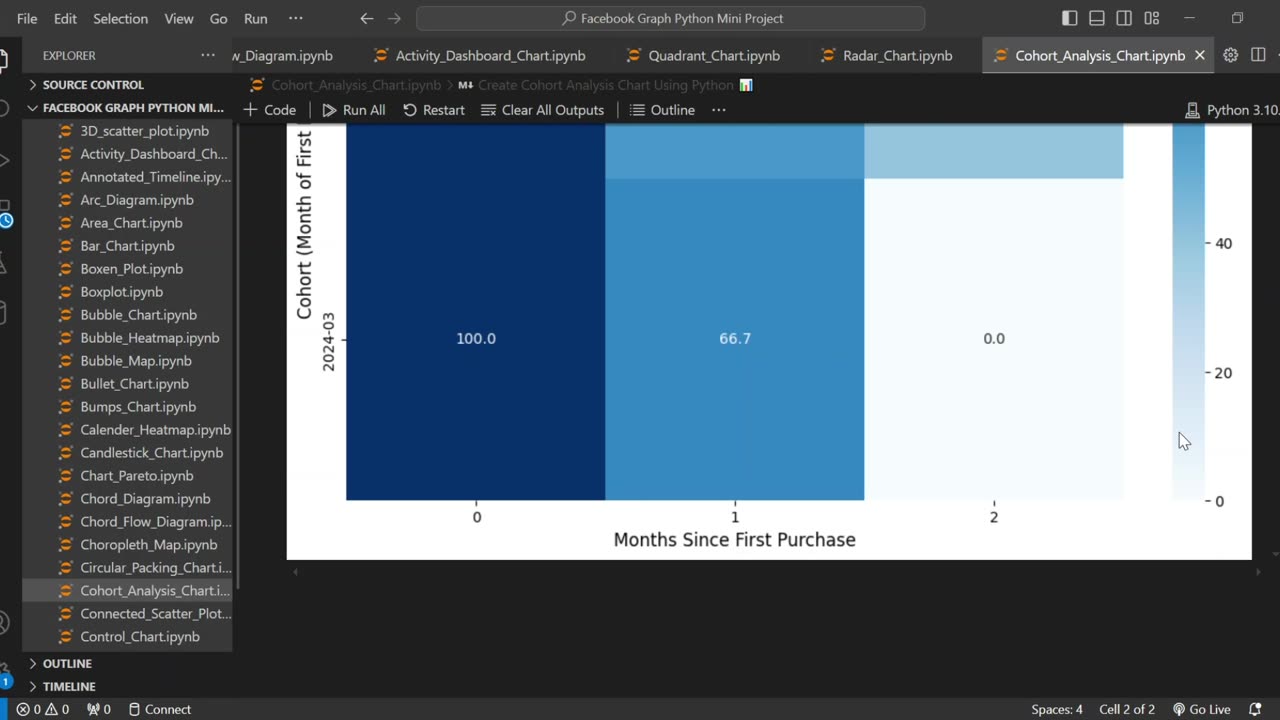
Learn how to perform cohort analysis in Python to track customer retention and business growth! In this tutorial, I'll show you how to use Pandas, Seaborn, and Matplotlib to visualize customer behavior patterns.
📌 What You'll Learn:
✔ How to prepare transaction data for cohort analysis
✔ Calculate customer retention rates using Pandas
✔ Create professional heatmap visualizations with Seaborn
✔ Interpret results to improve business decisions
🔔 Subscribe for more Python & data science tutorials!
💬 Questions? Drop them in the comments!
#Python #CohortAnalysis #DataScience #Pandas #Seaborn #DataVisualization #PythonTutorial #BusinessAnalytics #CustomerRetention #DataAnalysis #MachineLearning #Programming #Tech #Coding #LearnPython
-
 1:02
1:02
AI Evolutionary Technology
1 month agoLive Weather App in Python | BeautifulSoup & Web Scraping Tutorial
71 -
 48:03
48:03
Coin Stories with Natalie Brunell
18 hours agoChristianity and Bitcoin: Why ‘You Shall Not Steal’ Demands Hard Money Not Fiat
1263 -
 22:38
22:38
Professor Nez
16 hours agoI've NEVER Seen Tucker Carlson like THIS...
2.2K6 -
 13:43
13:43
Actual Justice Warrior
1 day agoHomeless Psycho Tries To KILL Massage Workers
11.7K8 -
 15:46
15:46
BlaireWhite
1 day agoNetflix's LGBTQ Kids Content Is Hot Trash.
13K6 -
 36:54
36:54
Comedy Dynamics
5 days ago5 Spooky Moments from Jeff Dunham: Minding the Monsters
14.3K2 -
 9:22
9:22
MattMorseTV
12 hours ago $0.31 earnedTrump’s $20 billion GAMBLE just PAID OFF… BIG TIME.
69.1K28 -
 1:38:13
Brandon Gentile
6 days agoTOP Bitcoin CEO: This Is the Final Shakeout Before BTC Explodes
5.51K1 -
 13:21
13:21
Dr. Nick Zyrowski
5 days ago10 Dangerous Foods RFK Jr Just BANNED
12.1K23 -
 5:05
5:05
Legal Money Moves
9 days agoAI Is Making Rich People Richer (And Everyone Else Poorer)
6.8K6