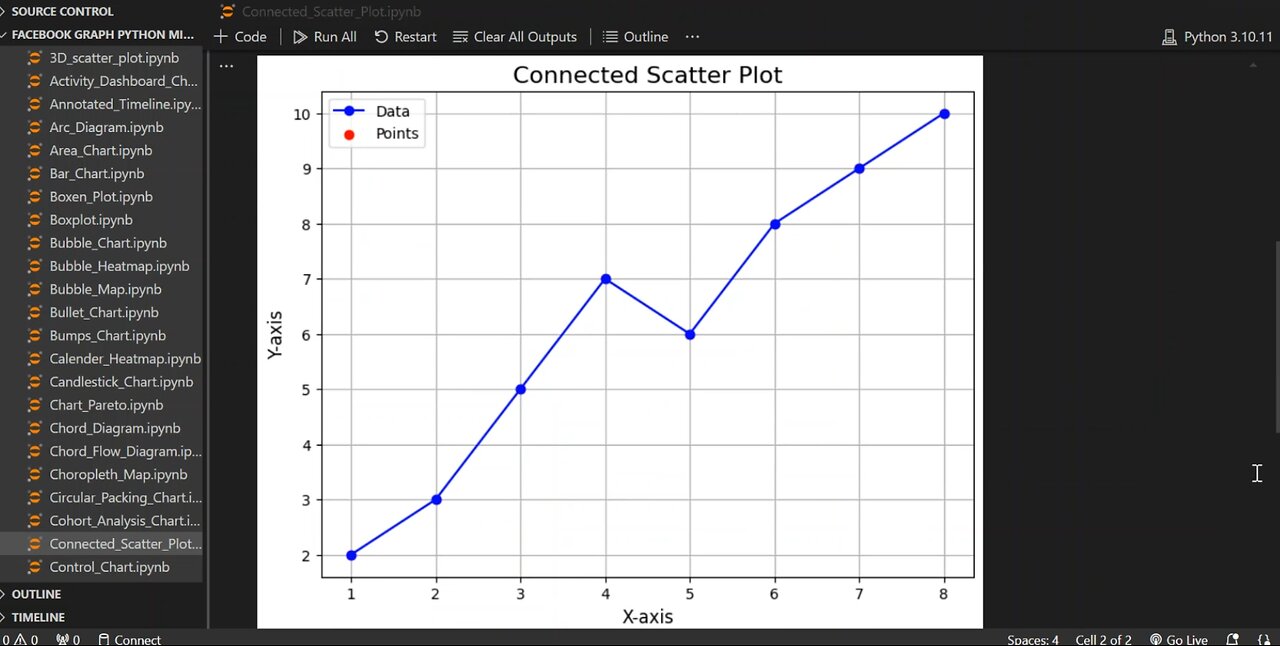
Create Connected Scatter Plot Using Python🔢
🔥 Learn how to create professional connected scatter plots in Python using Matplotlib!
In this step-by-step tutorial, I'll show you how to combine line plots and scatter plots to visualize your data effectively. Perfect for data analysis, scientific research, or just learning Python visualization!
📌 What You'll Learn:
✔ How to create a connected scatter plot with lines AND points
✔ Customize colors, markers, and labels for clarity
✔ Add legends and grids for better readability
✔ Format your plot for professional presentations
🔔 Subscribe for more Python & data science tutorials!
💬 Got questions? Ask in the comments!
#Python #Matplotlib #DataVisualization #DataScience #PythonTutorial #LearnPython #DataAnalysis #ScatterPlot #PythonProgramming #Coding #Tech #STEM #DataViz #PythonForBeginners #Programming #ComputerScience #DataAnalytics #TechTutorial #PythonCode #Visualization
-
 1:02
1:02
AI Evolutionary Technology
2 days agoLive Weather App in Python | BeautifulSoup & Web Scraping Tutorial
21 -
 26:57
26:57
Robbi On The Record
2 days agoMouth Breathing Is Why You’re Exhausted | with Dr. Melanie Silvestrini
49.9K6 -
 LIVE
LIVE
Total Horse Channel
8 hours ago2025 Reno Snaffle Bit Futurity | Sunday Finals
100 watching -
 40:44
40:44
SouthernbelleReacts
7 days ago $4.04 earned“Event Horizon (1997) Reaction | Hellraiser in Space with Sam Neill & Laurence Fishburne”
46.3K4 -
 10:49
10:49
Artur Stone Garage
3 days ago $2.75 earnedI Spent $2000 on My Turbo Honda Civic Build (Before & After)
44.4K12 -
 0:44
0:44
Danny Rayes
21 hours ago $4.51 earnedDid Someone Know It Was Going To Happen?
43K11 -
 15:03
15:03
World2Briggs
1 day ago $3.63 earnedShocking Home Prices in Florida's Cheapest Towns!
36.1K8 -
 58:02
58:02
ChopstickTravel
4 days ago $1.58 earnedBillionaire Food in Dubai 🇦🇪 Super Luxury MICHELIN +WAGYU + CAVIAR in UAE!
25.9K1 -
 21:20
21:20
Advanced Level Diagnostics
12 days ago $1.22 earned2020 Toyota Sienna - Crank No Start! Never Seen This Before!
27K2 -
 49:04
49:04
The Why Files
6 days agoMajestic 12 | Secret Documents Expose UFO Cover-Up Vol. 1
62.2K72