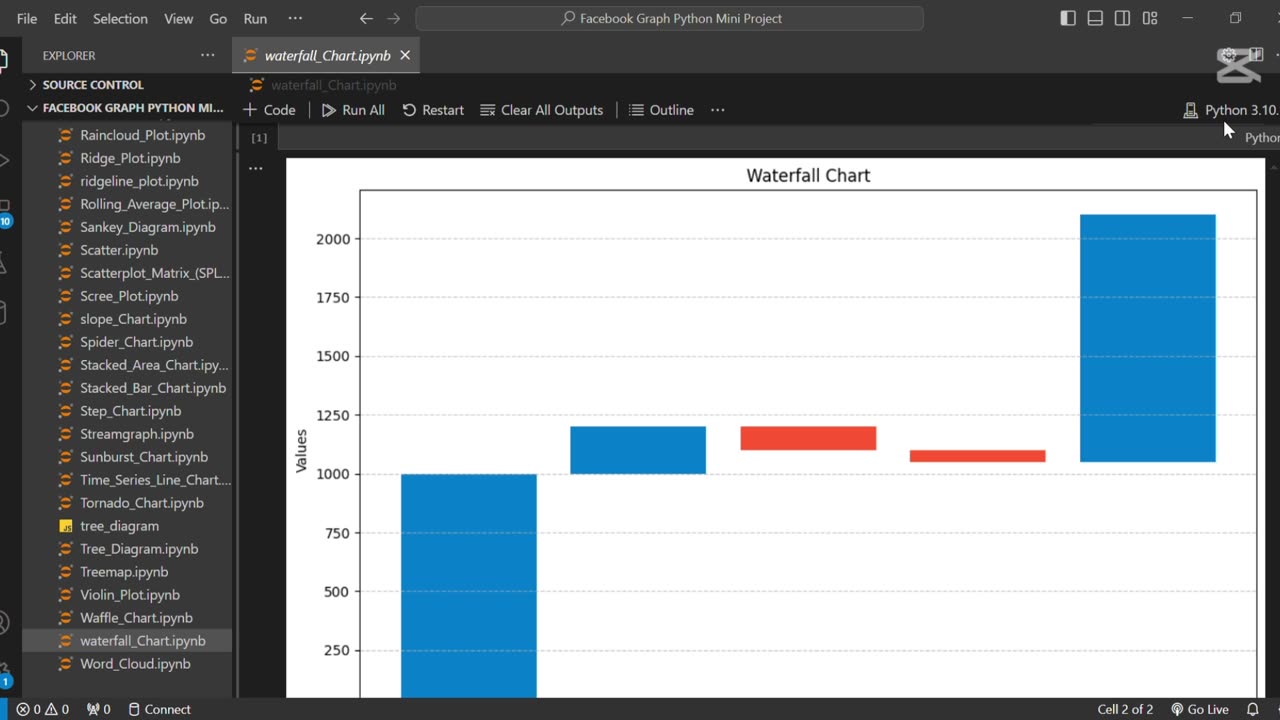
Create a waterfall chart 📊 using Python 🐍
📊 Master Waterfall Charts in Python with this Step-by-Step Matplotlib Tutorial!
In this video, you'll learn how to create professional waterfall charts for financial analysis, business reporting, or any data visualization need using Python's Matplotlib and Pandas.
🔍 What You'll Learn:
✅ How to structure data for waterfall charts
✅ Calculate cumulative values with Pandas
✅ Customize colors for positive/negative values
✅ Add professional styling with grid lines and labels
✅ Perfect for financial analysis, profit reporting, and business metrics
💬 Let's Connect!
Subscribe for more Python data visualization tutorials
Like if you found this helpful
Comment: "What business metric should I visualize next?"
#Python #DataVisualization #WaterfallChart #Matplotlib #Pandas #PythonTutorial #DataScience #FinancialAnalysis #BusinessIntelligence #DataAnalytics #PythonProgramming #Coding #LearnPython #DataViz #TechTutorial
-
 0:18
0:18
AI Evolutionary Technology
1 month ago💰 Simple Currency Converter App in Python
20 -
 21:39
21:39
Nikko Ortiz
2 days agoI Take A North Korean Shooting
14.3K4 -
 1:46:26
The Michelle Moore Show
17 hours ago'The Religion Invasion In the U.S. and the Deep State Agenda' Guest, Mark Taylor: The Michelle Moore Show (Nov 3, 2025)
21.3K21 -
 LIVE
LIVE
TruthStream with Joe and Scott
5 days agoSovereign Codes & Cosmic Infrastructure,Ufo's, UAP's, Monads, Matrix Satellites, Interstellar Visitors, SYRONA #505
255 watching -
 LIVE
LIVE
Lofi Girl
2 years agoSynthwave Radio 🌌 - beats to chill/game to
152 watching -
 5:55:11
MattMorseTV
10 hours ago $89.30 earned🔴Trump's '60 Minutes' INTERVIEW + MUCH MORE.🔴
152K42 -
 2:02:36
Badlands Media
15 hours agoBaseless Conspiracies Ep. 157: Jack the Ripper, the Crash & the Great Disclosure Countdown
31.6K20 -
 2:06:09
Inverted World Live
11 hours agoMysterious Crash at Area 51 | Ep. 134
40K14 -
 2:48:59
TimcastIRL
9 hours agoTrump Endorses Cuomo, Says NO COMMIE MAMDANI, Obama REFUSES To Endorse Mamdani | Timcast IRL
271K197 -
 5:51:16
Drew Hernandez
1 day agoGOP CIVIL WAR: TUCKER CARLSON DERANGEMENT SYNDROME AT ALL TIME HIGH
55.4K42