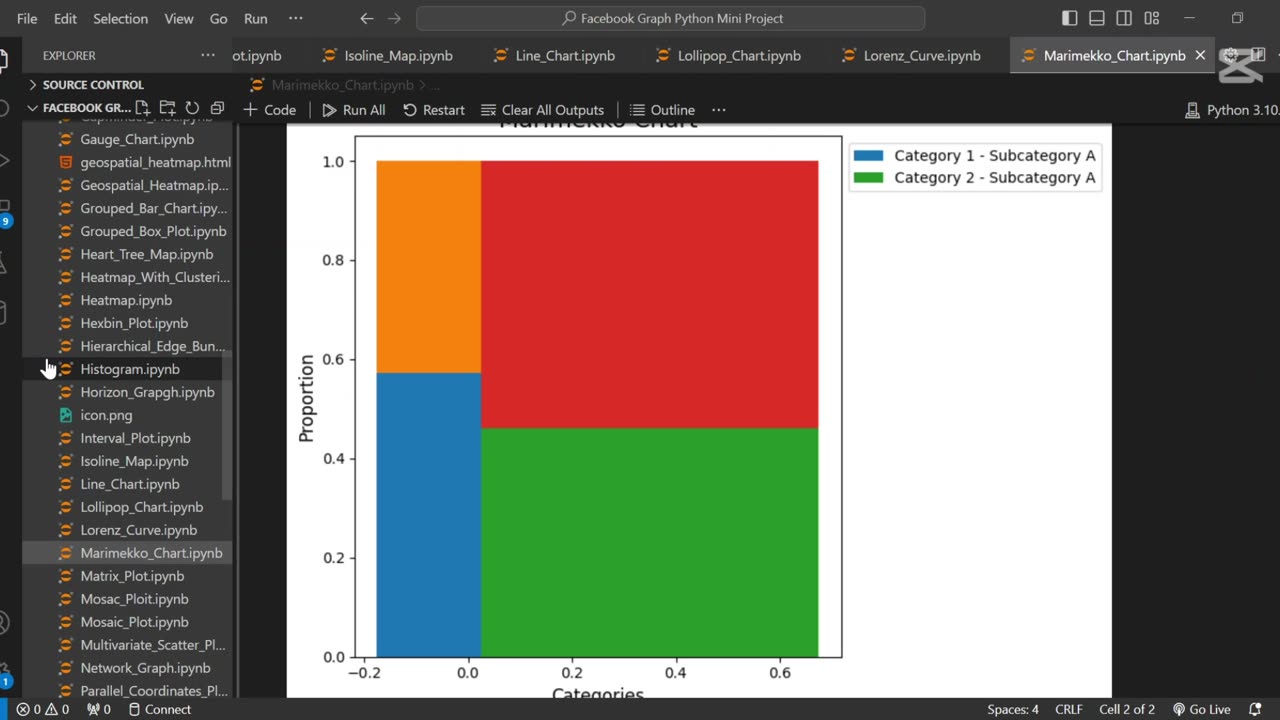
Create Marimekko chart using Python 📊
📊 How to Make Marimekko Charts with Matplotlib | Step-by-Step Guide | Python Tutorial
In this Python data visualization tutorial, you’ll learn how to create professional Marimekko Charts (also known as Mosaic Plots) using Matplotlib. Marimekko charts are perfect for visualizing multi-dimensional proportional data, making them essential for business analytics, market research, and data science!
🔹 What You’ll Learn:
✅ How to structure data for Marimekko charts
✅ Step-by-step coding in Python (Matplotlib)
✅ Customizing colors, labels, and legends
✅ Practical use cases for business & data analysis
🚀 Subscribe for More Python & Data Science Tutorials!
🔔 Hit the bell icon to stay updated!
💬 Got questions? Drop them in the comments!
#Python #DataVisualization #MarimekkoChart #Matplotlib #DataScience
#PythonTutorial #Coding #DataAnalysis #Programming #TechTutorial #LearnPython #DataViz #BusinessAnalytics #PythonProgramming #DataVisualizationTutorial
-
 0:16
0:16
AI Evolutionary Technology
1 month agoCreate Email Check Account Services Using Python
6 -
 7:37
7:37
The Shannon Joy Show
12 hours agoThe U.S. Economy is in SHAMBLES.
5523 -
 48:03
48:03
Coin Stories with Natalie Brunell
18 hours agoChristianity and Bitcoin: Why ‘You Shall Not Steal’ Demands Hard Money Not Fiat
1261 -
 22:38
22:38
Professor Nez
16 hours agoI've NEVER Seen Tucker Carlson like THIS...
2.2K6 -
 13:43
13:43
Actual Justice Warrior
1 day agoHomeless Psycho Tries To KILL Massage Workers
11.7K8 -
 15:46
15:46
BlaireWhite
1 day agoNetflix's LGBTQ Kids Content Is Hot Trash.
13K6 -
 36:54
36:54
Comedy Dynamics
5 days ago5 Spooky Moments from Jeff Dunham: Minding the Monsters
14.3K2 -
 9:22
9:22
MattMorseTV
12 hours ago $0.31 earnedTrump’s $20 billion GAMBLE just PAID OFF… BIG TIME.
69.1K28 -
 1:38:13
Brandon Gentile
6 days agoTOP Bitcoin CEO: This Is the Final Shakeout Before BTC Explodes
5.51K1 -
 13:21
13:21
Dr. Nick Zyrowski
5 days ago10 Dangerous Foods RFK Jr Just BANNED
12.1K23