Premium Only Content

Daily Update Podcast: The S&P 500 Remains Positive but Overbought
Link to The SPX Investing Program https://spxinvesting.substack.com
Link to The Daily Pivot Newsletter: https://thedailypivotnewsletter.substack.com/
Join this channel to get access to perks:
https://www.youtube.com/channel/UCxlaGAKm2ApEs13O1gWDltg/join
Market Summary for Monday, May 19, 2025 and Outlook for Tuesday May 20, 2025
Market Performance: The market showed resilience, closing slightly positive (+0.09%) on below-average volume despite a lower open triggered by Moody's downgrade of U.S. debt due to high debt levels. Prices gapped lower below 5,900, setting the intraday low, climbed above S1 (5924), faced resistance at the daily pivot (5941), and ended with late-day buying, barely positive.
Trend Confirmation: The market is in a confirmed uptrend, with both short-term and intermediate-term ADX crossing above 20. It remains positive across short, intermediate, and long-term timeframes, as prices are above the 20, 50, and 200-day moving averages.
Overbought Conditions: The market is overextended, with indicators such as the StochRSI, Williams %R, CCI, and Stochastics showing extreme positive readings. The S&P is far from its 20- and 50-period moving averages, signaling overbought conditions.
Interest Rates and Sentiment: The 10-year yield briefly rose above 4.5% but closed below it at 4.47%. Sentiment dipped slightly to 70 (from 71), still high but not yet at the cautionary 75 level.
Economic Indicators: The Leading Economic Index fell 1% (vs. expected -0.7%), marking five consecutive months of declines, raising recession concerns if the six-month growth rate drops further.
Market Dynamics: Optimism and FOMO are driving buy-the-dips. Defensive sectors (healthcare, utilities, staples) outperformed, while tech and discretionary lagged. The market shrugged off the Moody’s downgrade, and a potential Congressional reconciliation bill added positivity.
Technical Indicators: Many indicators (e.g., MACD, PMO, TTM Squeeze) are extreme positive, with some showing early signs of rolling over (e.g., slope oscillator, TTM Squeeze). Negative divergences are appearing in the McClellan Oscillators and the advance-decline oscillator, suggesting potential slowdowns.
Sector and Stock Performance: The Dow was up 0.33%, Canada hit a new all-time high, but small and mid-caps struggled. Large-cap tech (e.g., Apple, Tesla) showed mixed results, with no clear leadership.
Other Assets: The dollar weakened but recovered slightly; oil remained in the low $60s; inflation (per Truflation) is nearing 2%. Bonds and commodities are negative.
Outlook for Tuesday, May 20, 2025
Economic Calendar: No major economic reports are due. Markets will focus on geopolitical developments, trade wars, and tariffs. Initial jobless claims on Thursday are the week’s key report.
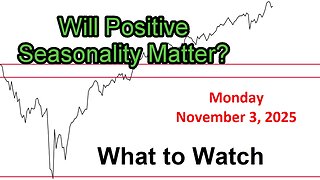
Seasonality: Historical data shows May 20th as negative, but post-election years have positive seasonality. The week after options expiration is up two-thirds of the time since 1980.
Technical Outlook: The market remains positive across all timeframes but is overbought with emerging negative divergences, suggesting caution. Growth-to-value and discretionary-to-staples ratios are in downtrends but improving and above moving averages.
Key Levels: Pivot points updated on the YouTube community tab. The S&P is well above the 5575-pivot level, with resistance at R1 for small caps proving challenging.
Conclusion:
The market is bullish but overextended, with potential for a slowdown due to negative divergences and high valuations, particularly in the NASDAQ 100. Investors should monitor volume trends, interest rates, and tariff developments closely.
DISCLAIMER This video is for entertainment purposes only. I am not a financial adviser, and you should do your own research and go through your own thought process before investing in a position. Trading is risky!
-
 38:25
38:25
The SPX Investing Program
3 days agoWhat to Watch Update for Monday November 3, 2025
62 -
 1:17:04
DeVory Darkins
2 hours agoPelosi SURRENDERS announces retirement and Bernie Sanders makes stunning admission
25.3K39 -
 LIVE
LIVE
Dr Disrespect
4 hours ago🔴LIVE - DR DISRESPECT - ARC RAIDERS - QUEST MASTER
1,955 watching -
 1:57:50
The Charlie Kirk Show
2 hours agoErika's Interview + Auburn Aftermath | Schlichter, Lomez | 11.6.2025
64.5K6 -
 1:02:01
Sean Unpaved
2 hours agoTragedy Strikes: Kneeland's Remembrance, Spo's Inferno, CFB HC Rumors, & TNF Raiders-Broncos' Odds
5.24K -
 1:01:46
Timcast
2 hours agoBannon RIPS GOP For Dismissing Zohran, "This Is Very Serious"
106K66 -
 2:12:18
Side Scrollers Podcast
4 hours agoSide Scrollers VTuber TAKE OVER with Kirsche, Rev Says Desu & DarlingStrawb | Side Scrollers
22.7K3 -
 LIVE
LIVE
StoneMountain64
1 hour agoArc Raiders is actually INCREDIBLE
79 watching -
 2:03:04
MattMorseTV
4 hours ago $0.54 earned🔴Trump’s EMERGENCY Oval Office ANNOUNCEMENT.🔴
45.1K59 -
 LIVE
LIVE
GrimmHollywood
5 hours ago🔴LIVE • GRIMM HOLLYWOOD and BIG TALL REDNECK • 3K 3XL TAKEDOWN • PGA • BF6 REDSEC • ARC RAIDERS
63 watching