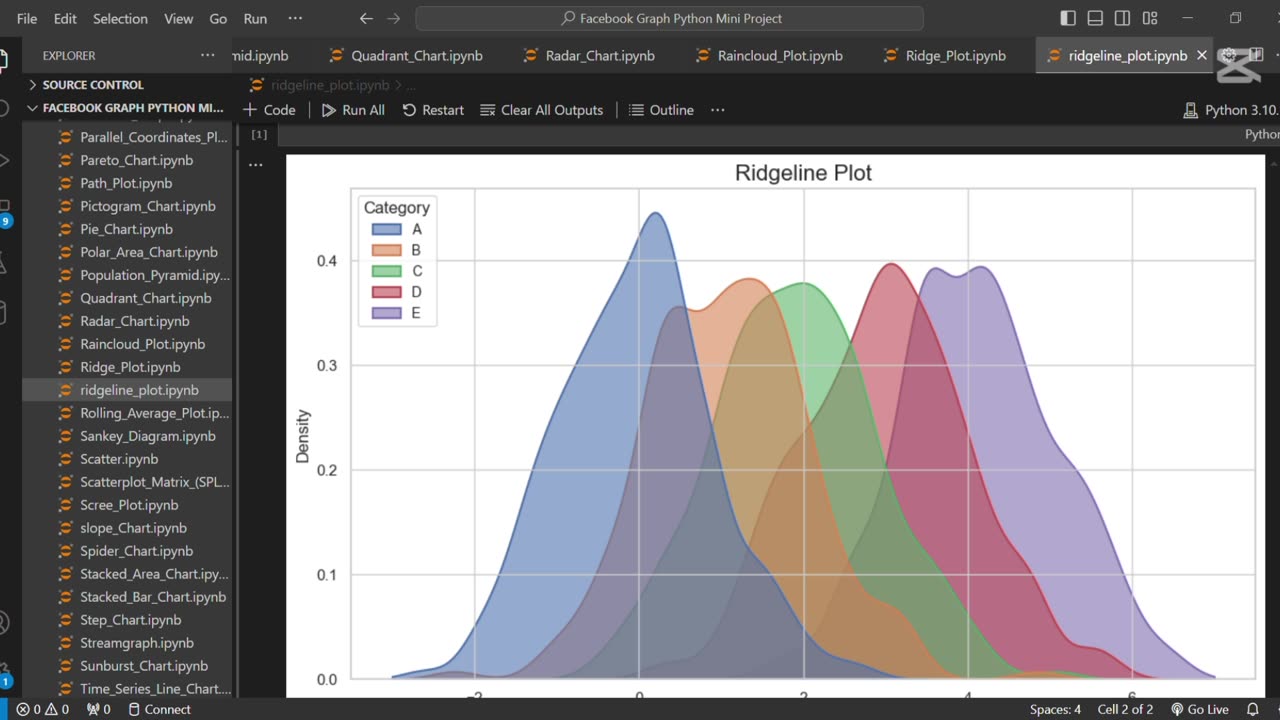
Create Beautiful Ridgeline Plots in Python using Seaborn 🌄
6 months ago
8
Unlock the power of ridgeline plots to visualize distributions across multiple categories with elegance.
Using Seaborn and a few handy tweaks, you can create smooth, layered plots that are both insightful and beautiful.
Perfect for comparing trends in data over time or across groups with a stunning visual appeal. 🌈
Loading 1 comment...
-
 0:20
0:20
AI Evolutionary Technology
2 months agoUsing Python to Analyze Your Internet Connection
201 -
 1:01:47
Timcast
1 hour agoTrump Orders "Complete Blockade" of Venezuela, Potential Act of WAR
37.5K37 -
 LIVE
LIVE
Steven Crowder
3 hours ago🔴 Vanity Fair's Susie Wiles Hit Piece: Who's To Blame PLUS Special Guest Jillian Michaels
32,525 watching -
 1:17:06
The Rubin Report
2 hours agoLeftist Insults Jillian Michaels on Piers Morgan & It Gets Brutal Fast
22.3K5 -
 LIVE
LIVE
Sean Unpaved
1 hour agoMike McDaniel & Dolphins BENCH Tua Tagovailoa For Quinn Ewers! | UNPAVED
57 watching -
 3:12:33
Misfits Mania
16 hours ago $23.55 earnedANDREW TATE VS CHASE DEMOOR OFFICIAL OPEN WORKOUT
183K20 -
 LIVE
LIVE
LFA TV
16 hours agoLIVE & BREAKING NEWS! | WEDNESDAY 12/17/25
2,682 watching -
 LIVE
LIVE
SternAmerican
23 hours agoFINAL ELECTION INTEGRITY CALL OF 2025 – WEDNESDAY, DECEMBER 17 | 1:00 PM EST
145 watching -
 1:04:41
MYLUNCHBREAK CHANNEL PAGE
2 hours agoA.I. Destroys History
4.62K5 -
 LIVE
LIVE
The Mel K Show
2 hours agoMORNINGS WITH MEL K- Confronting Inverted Truth & Suicidal Empathy - 12-17-25
689 watching