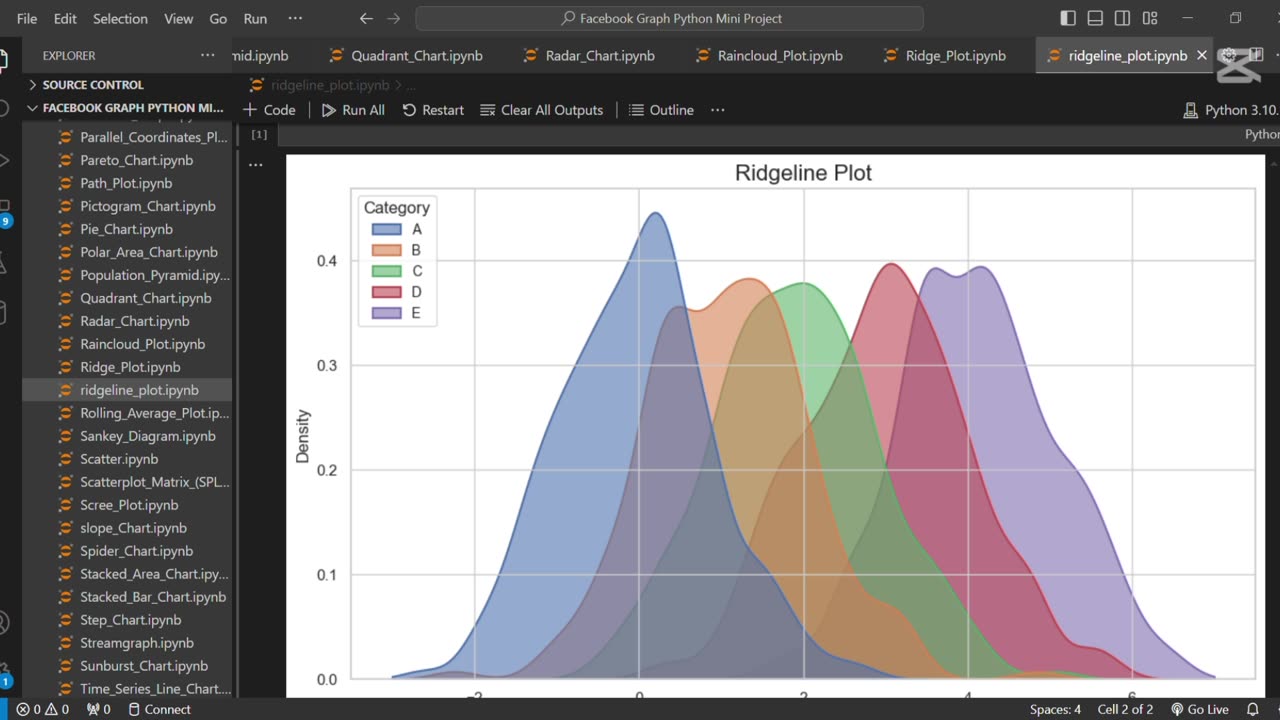
Create Beautiful Ridgeline Plots in Python using Seaborn 🌄
3 months ago
8
Unlock the power of ridgeline plots to visualize distributions across multiple categories with elegance.
Using Seaborn and a few handy tweaks, you can create smooth, layered plots that are both insightful and beautiful.
Perfect for comparing trends in data over time or across groups with a stunning visual appeal. 🌈
Loading 1 comment...
-
 1:06
1:06
AI Evolutionary Technology
4 days agoAdd Stunning Colors to Your Python Console | Text Styling Made Easy
7 -
 LIVE
LIVE
Wendy Bell Radio
4 hours agoThe Left Lives In A Bubble
2,425 watching -
 LIVE
LIVE
LFA TV
2 hours agoLFA TV ALL DAY STREAM - TUESDAY 9/16/25
10,743 watching -
 1:16:57
JULIE GREEN MINISTRIES
2 hours agoLIVE WITH JULIE
32.7K107 -
 1:16:24
Game On!
21 hours ago $2.15 earnedJoe Burrow And The Bengals Season IS OVER Despite Being 2-0!
11.9K2 -
 6:32
6:32
WhaddoYouMeme
16 hours ago $3.67 earnedChristians, These Reactions Should Disturb You
11.3K30 -
 9:59
9:59
Clownfish TV
15 hours agoWarner Bros and Paramount are MERGING?! | Clownfish TV
14K3 -
 19:19
19:19
World2Briggs
1 day ago $1.11 earnedTop 10 Amazing States With The Lowest Taxes.
12K1 -

BEK TV
1 day agoTrent Loos in the Morning - 9/16/2025
13.1K1 -
 LIVE
LIVE
The Bubba Army
22 hours agoDid Charlie Kirk's Killer, Confess On Discord? - Bubba the Love Sponge® Show | 9/16/25
1,959 watching