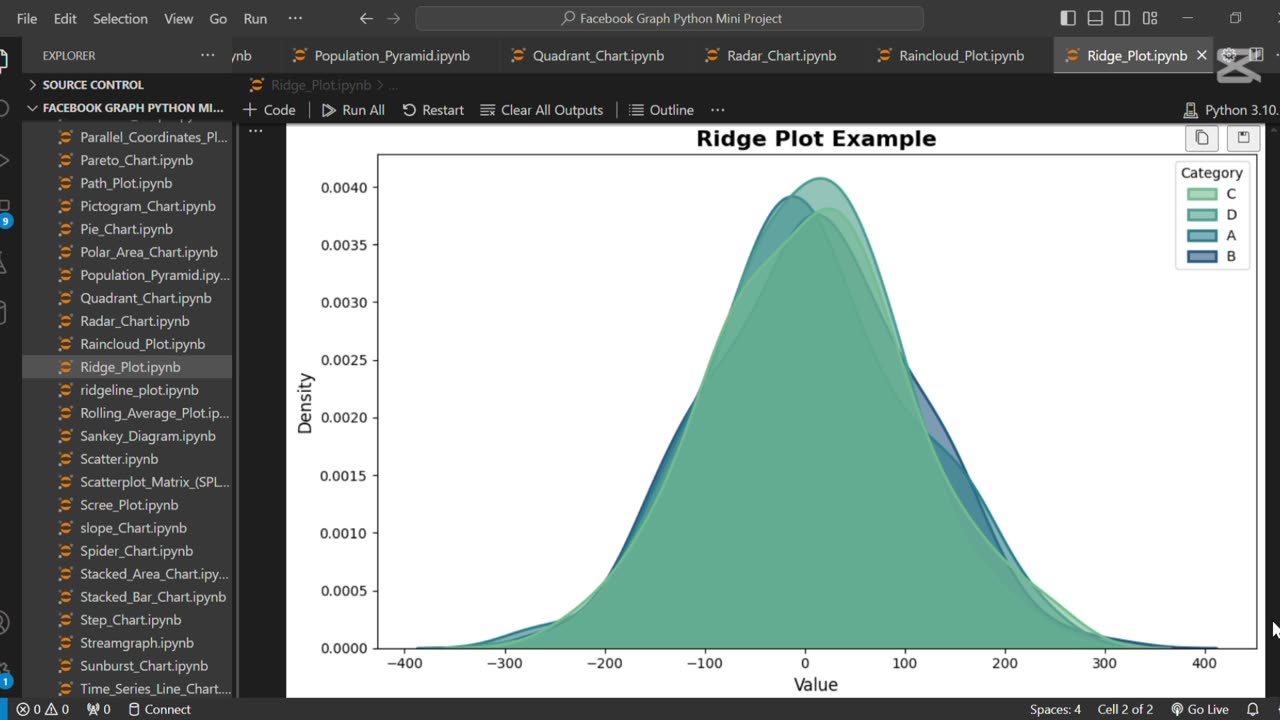
Create the ridge plot using python 🐧
Loading 1 comment...
-
 0:16
0:16
AI Evolutionary Technology
1 month agoCreate Email Check Account Services Using Python
7 -
 8:40
8:40
MattMorseTV
14 hours ago $5.67 earnedSchumer just KICKED OFF the Left-Wing CIVIL WAR.
7.59K25 -
 21:39
21:39
Nikko Ortiz
2 days agoI Take A North Korean Shooting
14.3K4 -
 1:46:26
The Michelle Moore Show
17 hours ago'The Religion Invasion In the U.S. and the Deep State Agenda' Guest, Mark Taylor: The Michelle Moore Show (Nov 3, 2025)
16.7K21 -
 LIVE
LIVE
TruthStream with Joe and Scott
5 days agoSovereign Codes & Cosmic Infrastructure,Ufo's, UAP's, Monads, Matrix Satellites, Interstellar Visitors, SYRONA #505
255 watching -
 LIVE
LIVE
Lofi Girl
2 years agoSynthwave Radio 🌌 - beats to chill/game to
152 watching -
 5:55:11
MattMorseTV
10 hours ago $89.30 earned🔴Trump's '60 Minutes' INTERVIEW + MUCH MORE.🔴
152K42 -
 2:02:36
Badlands Media
15 hours agoBaseless Conspiracies Ep. 157: Jack the Ripper, the Crash & the Great Disclosure Countdown
31.6K20 -
 2:06:09
Inverted World Live
11 hours agoMysterious Crash at Area 51 | Ep. 134
36.3K14 -
 2:48:59
TimcastIRL
9 hours agoTrump Endorses Cuomo, Says NO COMMIE MAMDANI, Obama REFUSES To Endorse Mamdani | Timcast IRL
271K197