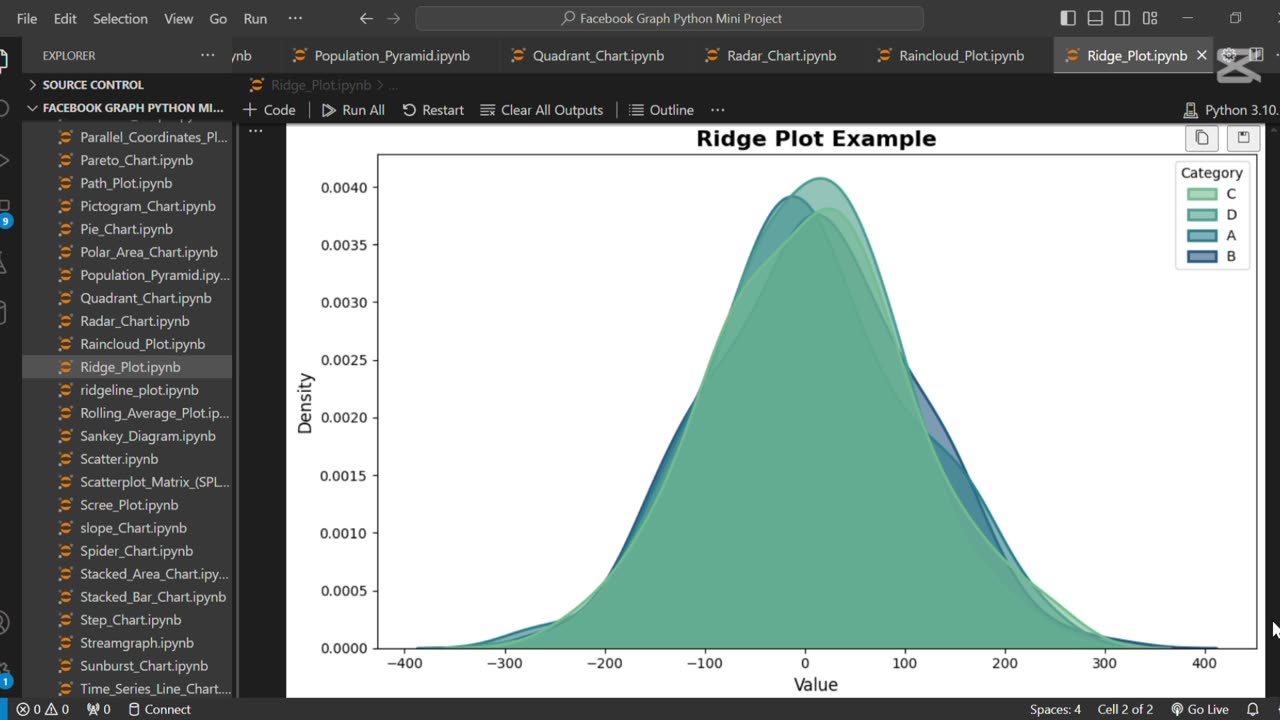
Create the ridge plot using python 🐧
Loading 1 comment...
-
 0:16
0:16
AI Evolutionary Technology
2 months agoCreate Email Check Account Services Using Python
9 -
 3:12:33
Misfits Mania
16 hours ago $23.55 earnedANDREW TATE VS CHASE DEMOOR OFFICIAL OPEN WORKOUT
183K20 -
 LIVE
LIVE
LFA TV
16 hours agoLIVE & BREAKING NEWS! | WEDNESDAY 12/17/25
2,676 watching -
 LIVE
LIVE
SternAmerican
23 hours agoFINAL ELECTION INTEGRITY CALL OF 2025 – WEDNESDAY, DECEMBER 17 | 1:00 PM EST
145 watching -
 1:04:41
MYLUNCHBREAK CHANNEL PAGE
2 hours agoA.I. Destroys History
4.62K5 -
 LIVE
LIVE
The Mel K Show
2 hours agoMORNINGS WITH MEL K- Confronting Inverted Truth & Suicidal Empathy - 12-17-25
687 watching -
 LIVE
LIVE
The Shannon Joy Show
2 hours agoSJ LIVE Dec 17 - The Latest On #RealityDC: Queen Susie Takes Her Throne. Move Over Trump, There’s A New Sheriff In Town! With Special Guest - Independent Political Analyst Carey Wedler!
195 watching -
 LIVE
LIVE
Badlands Media
9 hours agoBreaking History Ep. 129
871 watching -
 55:14
55:14
Grant Stinchfield
1 hour agoWhat Are They Hiding at Brown University, Campus Wokeness Blocks the Truth!
2.14K1 -
 1:00:45
Trumpet Daily
1 hour agoTrumpet Daily LIVE | Dec. 17, 2025
1.46K