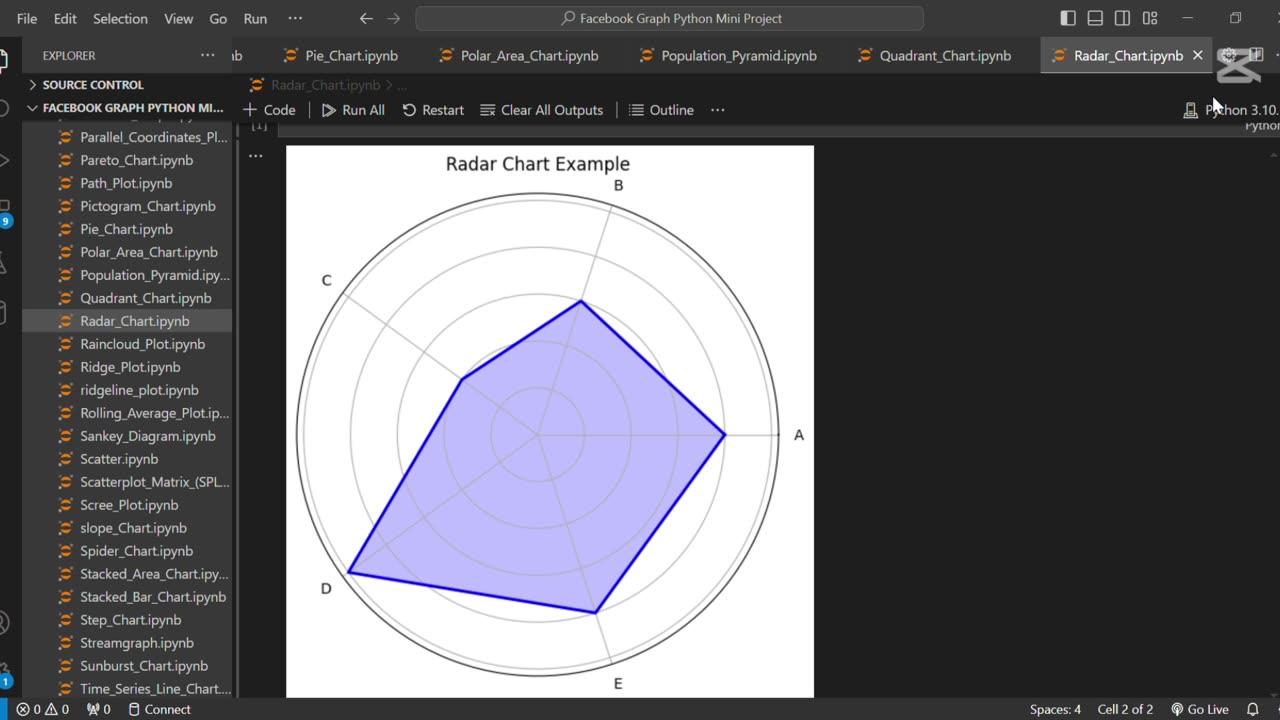
Create a Radar Chart using Python 🐍
Loading comments...
-
 0:09
0:09
AI Evolutionary Technology
5 days agoCreate Customs Custom Heart ASCII Art Using Python
31 -
 LIVE
LIVE
SternAmerican
23 hours agoFINAL ELECTION INTEGRITY CALL OF 2025 – WEDNESDAY, DECEMBER 17 | 1:00 PM EST
146 watching -
 1:04:41
MYLUNCHBREAK CHANNEL PAGE
2 hours agoA.I. Destroys History
4.62K5 -
 LIVE
LIVE
The Mel K Show
2 hours agoMORNINGS WITH MEL K- Confronting Inverted Truth & Suicidal Empathy - 12-17-25
689 watching -
 LIVE
LIVE
The Shannon Joy Show
2 hours agoSJ LIVE Dec 17 - The Latest On #RealityDC: Queen Susie Takes Her Throne. Move Over Trump, There’s A New Sheriff In Town! With Special Guest - Independent Political Analyst Carey Wedler!
194 watching -
 LIVE
LIVE
Badlands Media
9 hours agoBreaking History Ep. 129
872 watching -
 55:14
55:14
Grant Stinchfield
1 hour agoWhat Are They Hiding at Brown University, Campus Wokeness Blocks the Truth!
2.14K1 -
 1:00:45
Trumpet Daily
1 hour agoTrumpet Daily LIVE | Dec. 17, 2025
1.46K -
 25:37
25:37
Tudor Dixon
2 hours agoBondi Beach Attack, Radicalization, ISIS, and Rising Anti-Semitism | The Tudor Dixon Podcast
9112 -
 1:02:04
VINCE
4 hours agoAre We Really Being Told The Full Story? | Episode 190 - 12/17/25 VINCE
180K105