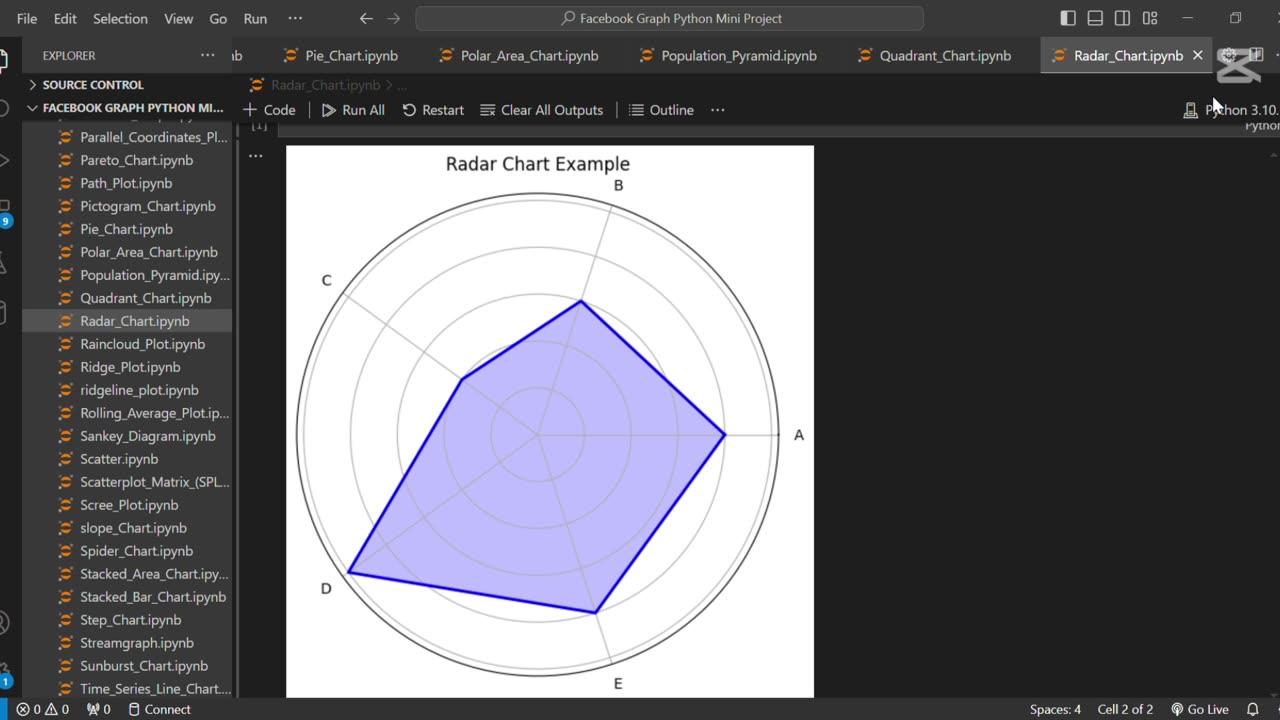
Create a Radar Chart using Python 🐍
Loading comments...
-
 0:17
0:17
AI Evolutionary Technology
17 hours agoVisualizing Molecular Structure From SMILES Using RDKit 🧪
1 -
 20:54
20:54
Professor Nez
15 hours ago🚨BREAKING: Shooter’s Own Words in Charlie Kirk Case Revealed
1.79K3 -
 16:48
16:48
itsSeanDaniel
15 hours agoGenius Republican Defends Charlie Kirk and CALLS OUT The Radical Left
2641 -
 9:09
9:09
Freedom Frontline
15 hours agoFox News Just Showed The Video Biden Never Wanted Seen
4.13K13 -
 0:27
0:27
historyofboxing
17 hours ago $0.13 earnedThe Cuban Machine… and Deadliest KO Phenom Right Now – David Morrell Jr
1.48K -
 38:07
38:07
Degenerate Plays
14 hours ago $0.24 earnedWorst Star Wars Character Pranks Us All - Call of Duty: Modern Warfare 3 (2011) : Part 3
3.66K -
 LIVE
LIVE
BEK TV
2 days agoTrent Loos in the Morning - 9/15/2025
179 watching -
 3:38:49
Badlands Media
1 day agoThe Narrative Ep. 38: The Sovereign World
118K62 -
 2:57:44
The Charlie Kirk Show
13 hours agoWASHINGTON D.C. PRAYER VIGIL FOR CHARLIE KIRK
266K451 -
 14:11
14:11
Robbi On The Record
15 hours agoThe Trap of Identity Politics: How Division is Killing America
32.8K56