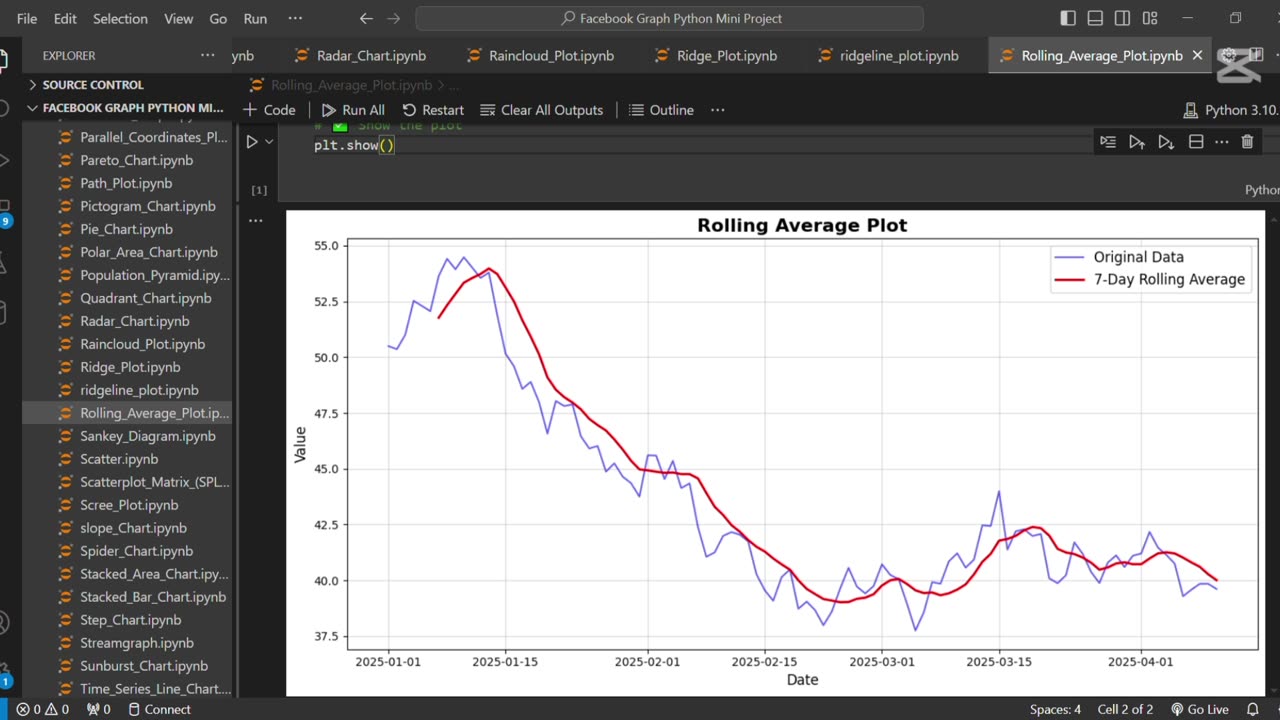
Create a rolling average plot using Python 📈
Loading comments...
-
 0:09
0:09
AI Evolutionary Technology
5 days agoCreate Customs Custom Heart ASCII Art Using Python
31 -
 LIVE
LIVE
DeVory Darkins
38 minutes agoIlhan Omar dealt MAJOR BLOW after CNN host catches her in a lie
16,197 watching -
 1:01:47
Timcast
1 hour agoTrump Orders "Complete Blockade" of Venezuela, Potential Act of WAR
37.5K38 -
 LIVE
LIVE
Steven Crowder
3 hours ago🔴 Vanity Fair's Susie Wiles Hit Piece: Who's To Blame PLUS Special Guest Jillian Michaels
32,526 watching -
 1:17:06
The Rubin Report
2 hours agoLeftist Insults Jillian Michaels on Piers Morgan & It Gets Brutal Fast
22.3K5 -
 LIVE
LIVE
Sean Unpaved
1 hour agoMike McDaniel & Dolphins BENCH Tua Tagovailoa For Quinn Ewers! | UNPAVED
59 watching -
 3:12:33
Misfits Mania
16 hours ago $23.55 earnedANDREW TATE VS CHASE DEMOOR OFFICIAL OPEN WORKOUT
183K20 -
 LIVE
LIVE
LFA TV
16 hours agoLIVE & BREAKING NEWS! | WEDNESDAY 12/17/25
2,681 watching -
 LIVE
LIVE
SternAmerican
23 hours agoFINAL ELECTION INTEGRITY CALL OF 2025 – WEDNESDAY, DECEMBER 17 | 1:00 PM EST
146 watching -
 1:04:41
MYLUNCHBREAK CHANNEL PAGE
2 hours agoA.I. Destroys History
4.62K5