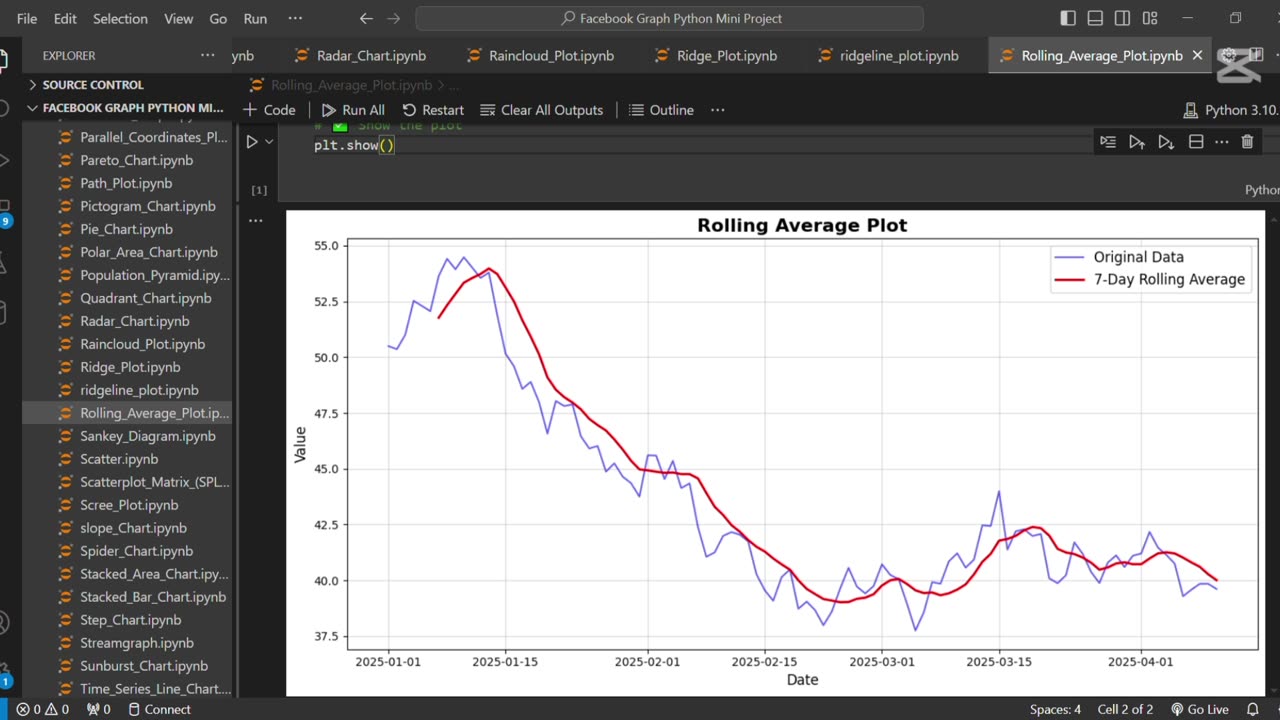
Create a rolling average plot using Python 📈
Loading comments...
-
 1:06
1:06
AI Evolutionary Technology
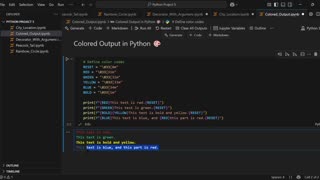
7 days agoAdd Stunning Colors to Your Python Console | Text Styling Made Easy
7 -
 8:07
8:07
The Officer Tatum
11 hours agoScott Jennings UNLEASHES On CNN Panel FEELING SORRY FOR SHOOTER
4.68K11 -
 2:05:40
Inverted World Live
5 hours agoThe Simulation is Burning & Missile Hits UFO in China | Ep. 110
77.7K6 -
 2:00:48
The Charlie Kirk Show
3 hours agoTHOUGHTCRIME Ep. 97 — The Thoughtcrime WILL Continue
86.3K69 -
 35:08
35:08
Colion Noir
8 hours agoA Bear, an AR-15, and a Home Invasion
10.7K3 -
 3:05:55
TimcastIRL
4 hours agoJimmy Kimmel Refuses To Apologize Over Charlie Kirk Comments, Blames Gun Violence | Timcast IRL
151K115 -
 2:44:24
Laura Loomer
7 hours agoEP144: Trump Cracks Down On Radical Left Terror Cells
37.8K10 -
 LIVE
LIVE
Drew Hernandez
9 hours agoLEFTISTS UNITE TO DEFEND KIMMEL & ANTIFA TO BE DESIGNATED TERRORISTS BY TRUMP
972 watching -
 1:12:32
The Charlie Kirk Show
5 hours agoTPUSA AT CSU CANDLELIGHT VIGIL
68.8K55 -
 6:53:45
Akademiks
7 hours agoCardi B is Pregnant! WERE IS WHAM????? Charlie Kirk fallout. Bro did D4VID MURK A 16 YR OLD GIRL?
42.6K5