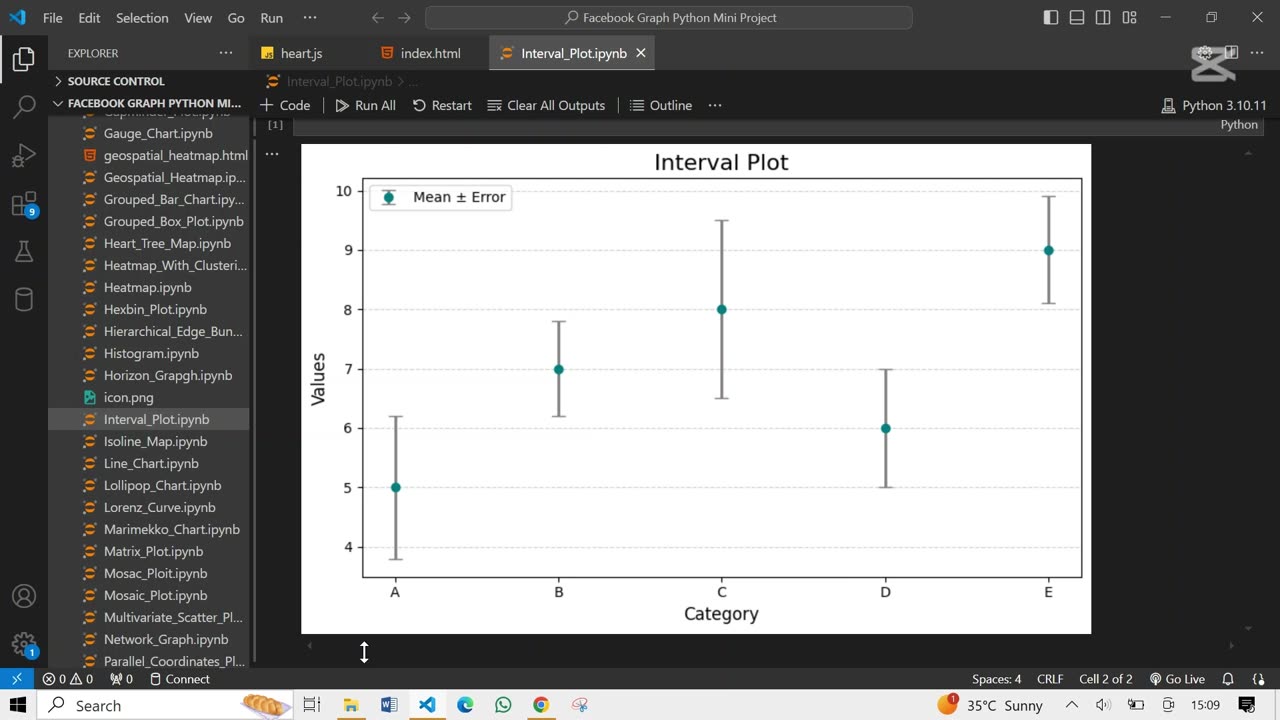
⏳ Create The Interval Plot Using Python
Loading comments...
-
 1:16
1:16
AI Evolutionary Technology
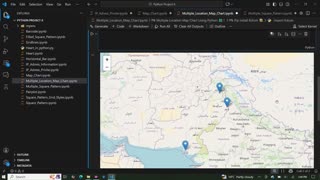
1 month agoCreate an Interactive City Map in Python Using Folium
6 -
 1:47:50
Kim Iversen
3 hours agoDon Lemon ARRESTED: Who Could Be Next?
15.5K48 -
 33:18
33:18
TheGuySwann
3 hours ago $0.24 earnedLive From Plan-B El Salvador - Guest Giacomo Zucco
5.39K1 -
 32:01
32:01
Stephan Livera
22 hours ago $0.32 earnedStephan Livera hosts Plan B Podcast in El Salvador
9.62K2 -
 1:05:27
Russell Brand
6 hours agoMedia Manipulation and the Manufacturing of Reality — SF676
147K59 -
 38:31
38:31
Stephan Livera
22 hours ago $1.39 earnedStephan Livera hosts Plan B Podcast in El Salvador
22.6K1 -
 32:52
32:52
vivafrei
9 hours agoLive from Plan B Conference in El Salvador with Erick Brimen on Prospera & Charter Cities!
74.5K1 -
 15:51
15:51
Chris From The 740
21 hours ago $0.37 earnedIs This The Best Gideon Optics Guardian Yet? | Fiber Dot Revolution!
12K2 -
 LIVE
LIVE
LFA TV
22 hours agoLIVE & BREAKING NEWS! | FRIDAY 1/30/26
909 watching -
 27:31
27:31
Live From Bitcoin Beach
9 hours ago $2.73 earnedThe Godfather of Bitcoin: Adam Back on Cypherpunks, El Salvador & Bitcoin's Next 10 Years
7.88K