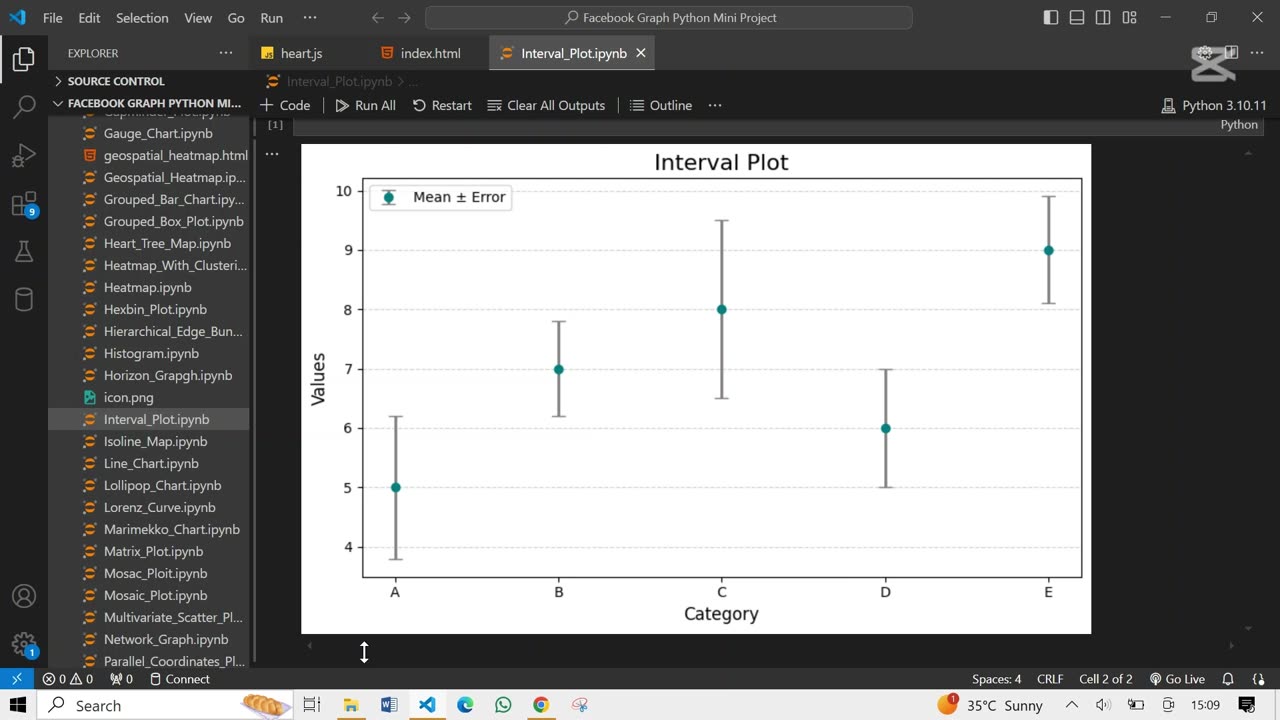
⏳ Create The Interval Plot Using Python
Loading comments...
-
 0:18
0:18
AI Evolutionary Technology
2 months ago💰 Simple Currency Converter App in Python
43 -
 1:19:51
Tundra Tactical
16 hours ago $11.26 earnedThursday Night Gun Fun!!! The Worlds Okayest Gun Show
52.4K -
 55:11
55:11
Sarah Westall
1 day agoHumanity Unchained: The Awakening of the Divine Feminine & Masculine w/ Dr. Brianna Ladapo
42.5K6 -
 1:42:41
Glenn Greenwald
10 hours agoReaction to Trump's Primetime Speech; Coldplay "Adultery" Couple Reappears for More Shame; Australia and the UK Obey Israel's Censorship Demands | SYSTEM UPDATE #560
148K86 -
 2:46:41
Barry Cunningham
8 hours agoBREAKING NEWS: President Trump Signs The National Defense Authorization Act | More News!
60.3K30 -
 43:10
43:10
Donald Trump Jr.
10 hours agoThe Days of Destructive DEI are Over, Plus Full News Coverage! | TRIGGERED Ep.301
118K89 -
 52:07
52:07
BonginoReport
9 hours agoThe Internet Picks Bongino’s FBI Replacement - Nightly Scroll w/ Hayley Caronia (Ep.200)
114K79 -
 55:30
55:30
Russell Brand
11 hours agoStay Free LIVE from AmFest — Turning Point USA - SF665
139K14 -
 1:11:26
Kim Iversen
12 hours agoTrump Pulls War Fake-Out…Attack on Venezuela Still Coming!?
90.8K117 -
 2:04:53
Redacted News
10 hours agoPutin just changed EVERYTHING with this move and NATO can't do anything | Redacted w Clayton Morris
182K154