Premium Only Content

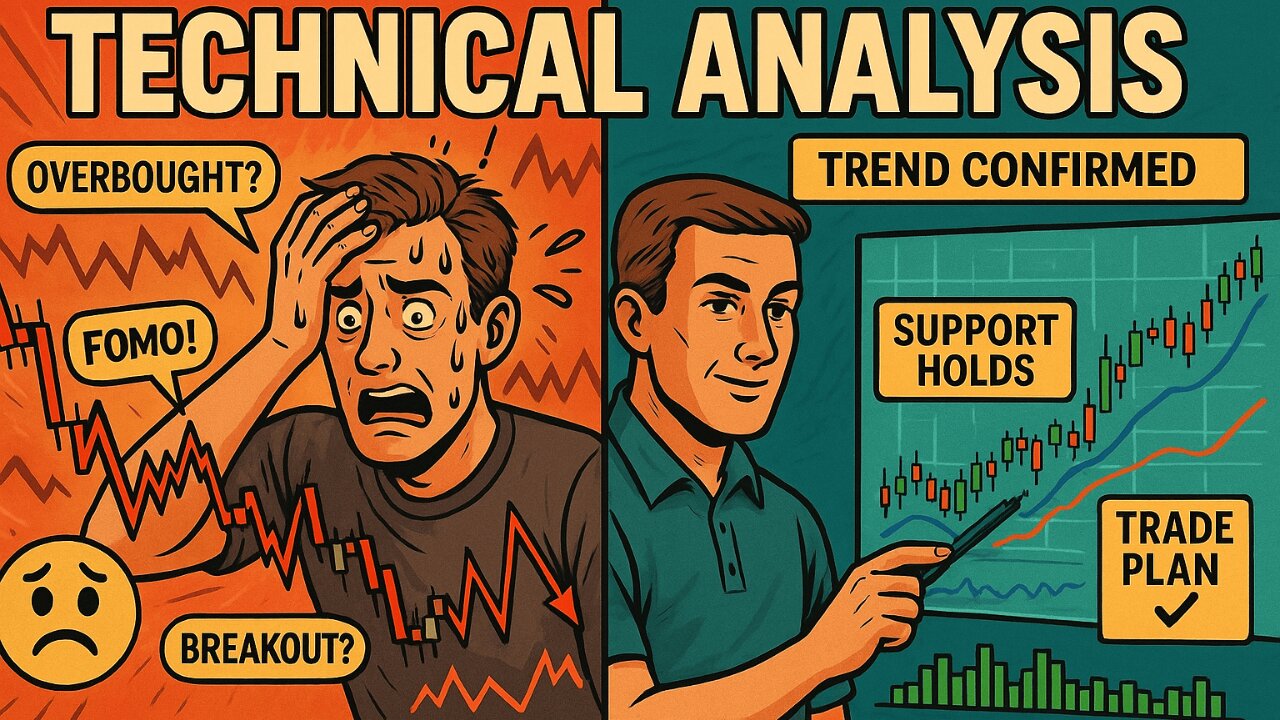
A Beginner’s Guide to Technical Analysis 📊🧠
The Beginner’s Guide to Technical Analysis 📈 breaks down the three core tools traders use to read price charts: drawing tools ✍️, indicators 📊, and candlestick patterns 🕯️. You’ll learn what each tool is, how it’s used, and see beginner-friendly examples of indicators to help you get started 🧠💡.
Support the channel by signing up to TradingView using this link:
https://www.tradingview.com/pricing/?share_your_love=netothemoon
It helps the channel grow at no extra cost to you. 🧠📈 Thank you for the support!
DISCLAIMER: The content provided by Mind Doodles (minddoodles.uk) is intended for educational and entertainment purposes only. It does not constitute professional financial advice, investment guidance, or mental health treatment. While ideas may relate to trading psychology, emotional regulation, or market behaviour, they are shared for general awareness only. Nothing in this content should be interpreted as a personalised recommendation. Always conduct your own research and seek appropriate professional advice before making any financial or mental health decisions. All forms of investing involve risk, and past performance does not guarantee future results. Mind Doodles does not accept any responsibility for losses, outcomes, or actions taken based on this content. By watching or engaging with this material, you acknowledge and agree to this disclaimer in full.
-
 LIVE
LIVE
Drew Hernandez
7 hours agoMASS CONFUSION AROUND CHARLIE'S MURDER
1,327 watching -
 1:01:40
HotZone
6 days ago"Prepare for WAR" - Confronting the URGENT Threat to America
1597 -
 20:23
20:23
Scammer Payback
7 hours agoTerrifying Scammers with File Deletions
6921 -
 16:22
16:22
The Gun Collective
4 hours agoWOW! 17 New Guns JUST GOT RELEASED!
2758 -
 1:13:57
Glenn Greenwald
5 hours agoYoung Men and Online Radicalization: Dissecting Internet Subcultures with Lee Fang, Katherine Dee, and Evan Barker | SYSTEM UPDATE #516
136K41 -
 1:14:57
Sarah Westall
2 hours agoCEO of Crowds on Demand: The Fake World of Social Media, Protests & Movements w/ Adam Swart
9.42K2 -
 DVR
DVR
Geeks + Gamers
5 hours agoTuesday Night's Main Event
38.6K2 -
 40:36
40:36
RiftTV
3 hours agoHow We Got 400 Leftists FIRED for MOCKING Charlie Kirk | The Rift | Guest: Olivia Krolczyk
42.6K28 -
 LIVE
LIVE
Badlands Media
17 hours agoBadlands Story Hour Ep 134: Godzilla Minus One
1,254 watching -
 LIVE
LIVE
Patriots With Grit
13 hours agoWrongful Death Without Consequences: Inside the Schara Trial | Scott Schara
109 watching