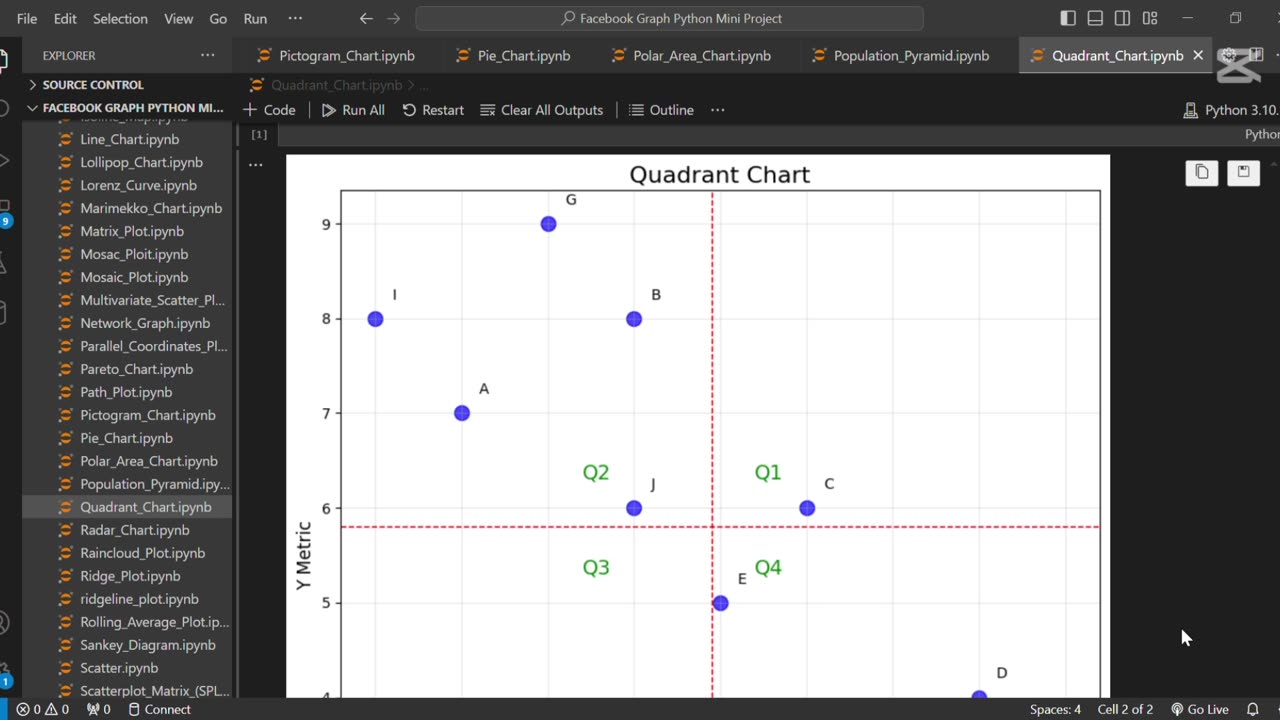
📍 Create Quadrant Chart Using Python
6 months ago
6
The line **"📍 Create Quadrant Chart Using Python"** refers to building a chart that divides data into four quadrants based on two variables, helping to categorize and compare items visually. Python libraries like Matplotlib or Plotly are commonly used to create such charts for decision-making and performance analysis.
Loading comments...
-
 0:20
0:20
AI Evolutionary Technology
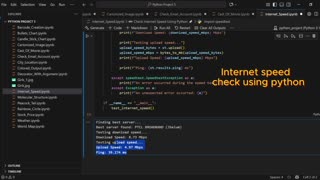
2 months agoUsing Python to Analyze Your Internet Connection
191 -
 17:33
17:33
Cash Jordan
2 hours ago25,000 Homeless SEIZE NYC’s Subway… as “Communist Mayor” HANDS CITY to SQUATTERS
1173 -
 1:01:04
The Rubin Report
2 hours agoMSNOW Host Realizes Ilhan Omar Is a Monster After Her Australia Shooting Reaction
19.1K38 -

The Bubba Army
3 days ago"ROB REINER MURDERED" By His Own Son? - Bubba the Love Sponge® Show | 12/15/25
8.82K -
 17:09
17:09
Professor Nez
1 hour agoObama’s Operative Just Got HUMILIATED After Trying to IMPEACH America!
9.8K17 -
 LIVE
LIVE
LFA TV
19 hours agoLIVE & BREAKING NEWS! | MONDAY 12/15/25
3,966 watching -
 59:10
59:10
VINCE
4 hours agoViolence Across The World: Brown University, Australia, Syria | Episode 188 - 12/15/25 VINCE
204K110 -
 LIVE
LIVE
The Shannon Joy Show
2 hours ago🔥SJ LIVE Dec 15 - A Violent Weekend, A Peoples Coup In Bulgaria & A Trump EO For Big Tech Granting Immunity & Supremacy🔥
196 watching -
 50:00
50:00
Grant Stinchfield
1 hour agoThe Cost of Wokeness... Disarmament Is the Danger
2.52K2 -
 2:28:14
Nikko Ortiz
2 hours agoReaction Time With Special Guest... | Rumble LIVE
26.1K