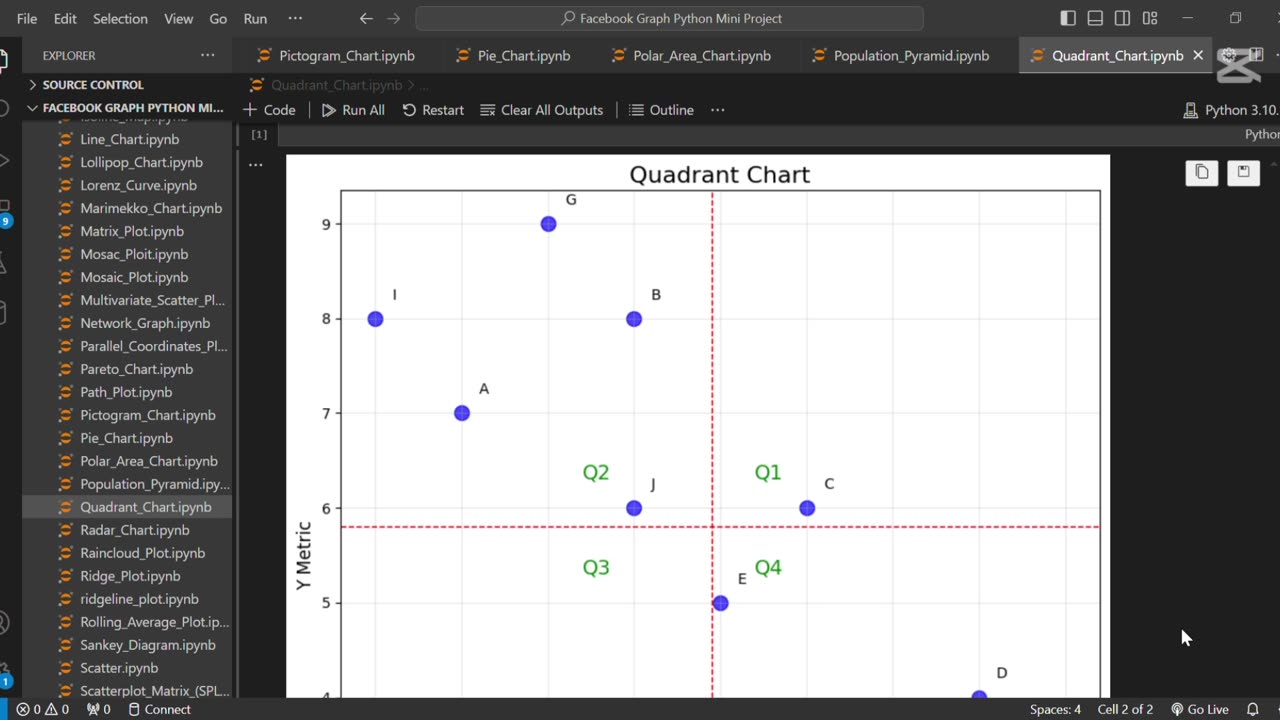
📍 Create Quadrant Chart Using Python
6 months ago
6
The line **"📍 Create Quadrant Chart Using Python"** refers to building a chart that divides data into four quadrants based on two variables, helping to categorize and compare items visually. Python libraries like Matplotlib or Plotly are commonly used to create such charts for decision-making and performance analysis.
Loading comments...
-
 1:17
1:17
AI Evolutionary Technology
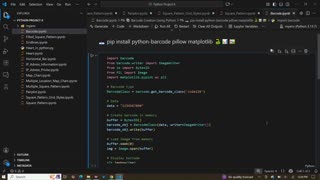
21 hours agoBuild a Barcode Generator in Python | Step-by-Step Tutorial for Beginners
1 -
 2:16:09
DLDAfterDark
4 hours ago $3.15 earnedThe Very Merry HotDog Waffle Christmas Stream! Gun Talk - God, Guns, and Gear
31.2K7 -
 1:19:51
Tundra Tactical
16 hours ago $11.26 earnedThursday Night Gun Fun!!! The Worlds Okayest Gun Show
52.4K -
 55:11
55:11
Sarah Westall
1 day agoHumanity Unchained: The Awakening of the Divine Feminine & Masculine w/ Dr. Brianna Ladapo
42.5K6 -
 1:42:41
Glenn Greenwald
10 hours agoReaction to Trump's Primetime Speech; Coldplay "Adultery" Couple Reappears for More Shame; Australia and the UK Obey Israel's Censorship Demands | SYSTEM UPDATE #560
148K86 -
 2:46:41
Barry Cunningham
8 hours agoBREAKING NEWS: President Trump Signs The National Defense Authorization Act | More News!
60.3K30 -
 43:10
43:10
Donald Trump Jr.
10 hours agoThe Days of Destructive DEI are Over, Plus Full News Coverage! | TRIGGERED Ep.301
118K89 -
 52:07
52:07
BonginoReport
9 hours agoThe Internet Picks Bongino’s FBI Replacement - Nightly Scroll w/ Hayley Caronia (Ep.200)
114K79 -
 55:30
55:30
Russell Brand
11 hours agoStay Free LIVE from AmFest — Turning Point USA - SF665
139K14 -
 1:11:26
Kim Iversen
12 hours agoTrump Pulls War Fake-Out…Attack on Venezuela Still Coming!?
90.8K117