👥 Create Population Pyramid Chart Using Python
4 months ago
4
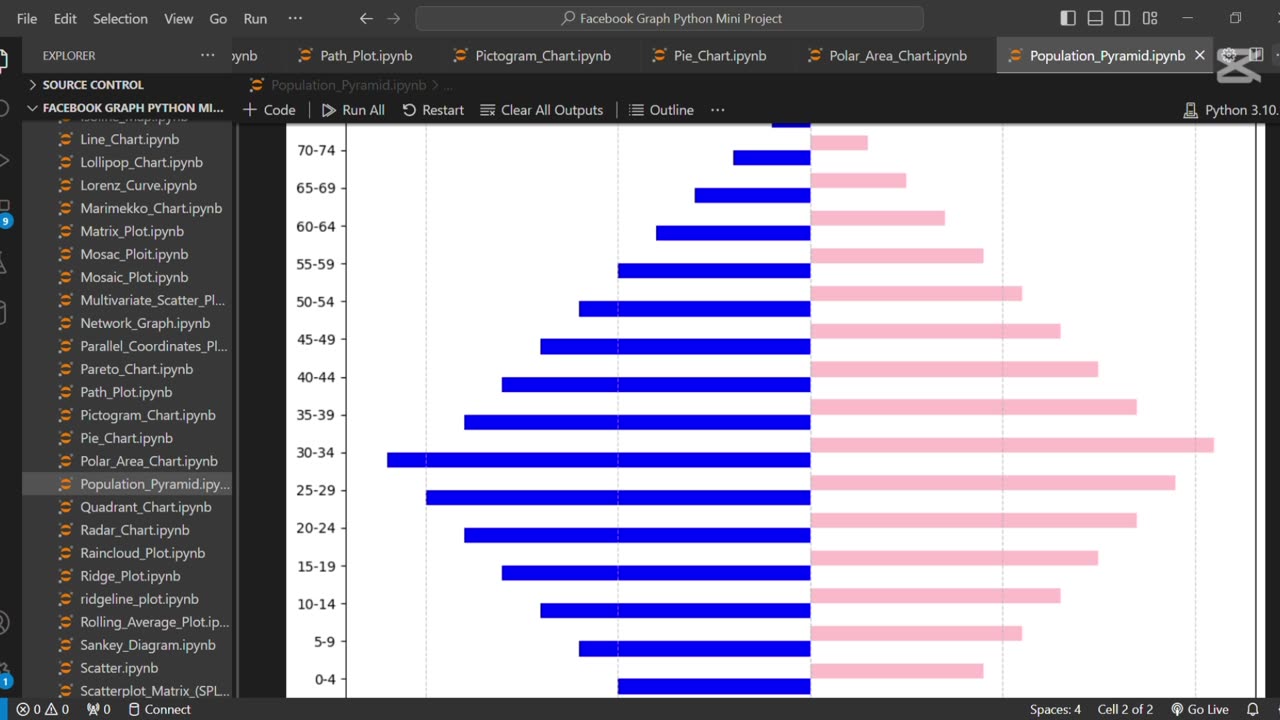
👥 Create Population Pyramid Chart Using Python" refers to visualizing age and gender distribution within a population using a mirrored bar chart. Python libraries like Matplotlib or Seaborn are typically used to create this chart, which is useful for demographic analysis and forecasting.
Loading comments...
-
 0:16
0:16
AI Evolutionary Technology
7 days agoCreate Email Check Account Services Using Python
2 -
 LIVE
LIVE
Badlands Media
8 hours agoDevolution Power Hour Ep. 394
4,739 watching -
 2:08:38
TimcastIRL
3 hours agoNetflix Shares TANK, Elon Says BOYCOTT After Writer MOCKS Charlie Kirk Assassination
149K88 -
 LIVE
LIVE
SpartakusLIVE
4 hours agoI'M BACK || Quads w/ The Boys
566 watching -
 9:33
9:33
Ken LaCorte: Elephants in Rooms
7 hours ago $0.03 earnedWhy Do Black Men Love Big Butts?
611 -
 2:12
2:12
From Zero → Viral with AI
1 day ago🚀 AI Marketing Isn’t Just for Big Brands Anymore — Here’s Why
27 -
 9:51:58
Dr Disrespect
11 hours ago🔴LIVE - DR DISRESPECT - 10 WINS ON CONTROLLER - BO7 TOMORROW
268K17 -
 1:24:56
Glenn Greenwald
5 hours agoTrump Declares Cities as the Enemies Within; Reagan Appointed Judge Slams Trump Over Speech Crackdowns; American ER Doctor on Gaza Atrocities | SYSTEM UPDATE #524
96.4K79 -
 LIVE
LIVE
I_Came_With_Fire_Podcast
11 hours agoPete Hegseth and the Chamber of Standards | Digital IDs | Taiwan Chips & Salsa | CDL Crisis
226 watching -
 LIVE
LIVE
Adam Does Movies
10 hours agoTalking Movies + Ask Me Anything - LIVE
42 watching