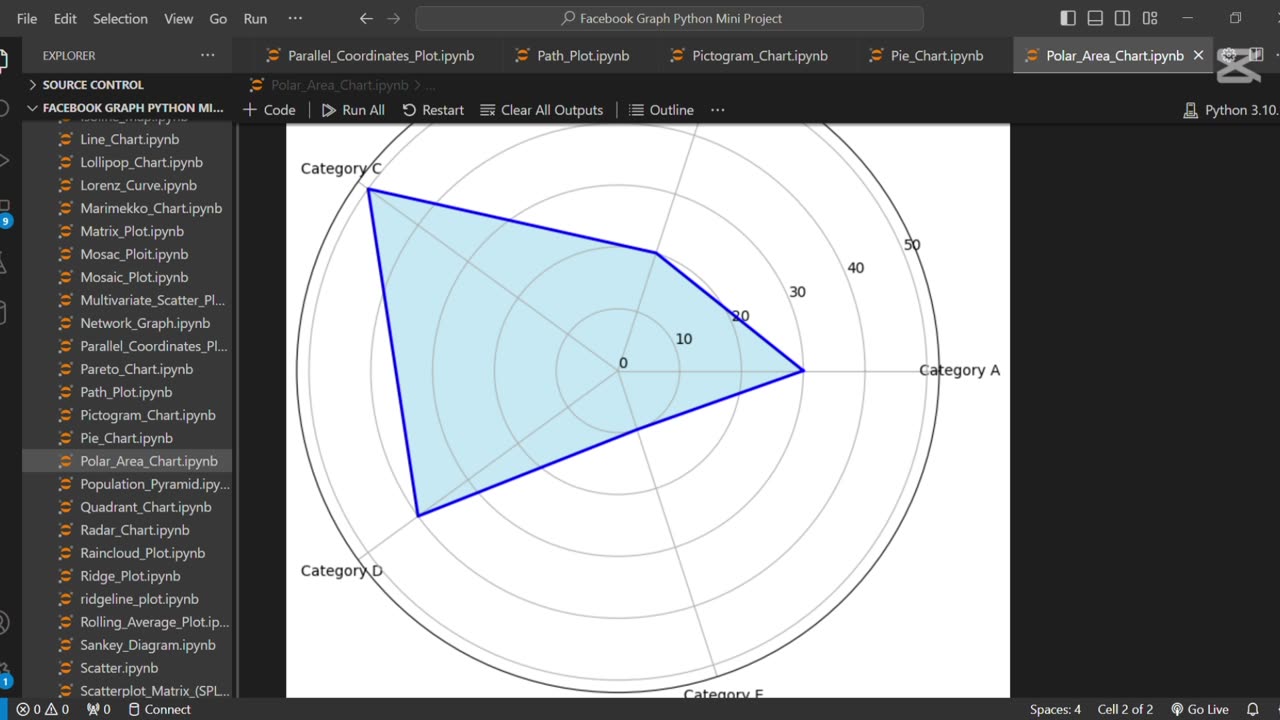
🔵 Create Polar Area Chart Using Python
3 months ago
The line "🔵 Create Polar Area Chart Using Python" refers to generating a circular chart where data is displayed in segments around a polar axis, with each segment's radius representing a value. Python libraries like Matplotlib are used to create these charts for visualizing cyclical data such as seasons, time, or directions.
Loading comments...
-
 1:05
1:05
AI Evolutionary Technology
4 days agoCreate Your Own Python Decorator | Repeat Functions Like a Pro
7 -
 LIVE
LIVE
LFA TV
13 hours agoLFA TV ALL DAY STREAM - MONDAY 9/15/25
5,167 watching -
 1:40:09
Dear America
2 hours agoBREAKING NEWS UPDATE! Dark Truth EXPOSED: Charlie Kirk's Assassin & the Trans Agenda-This Is WAR!
108K120 -
 LIVE
LIVE
Badlands Media
10 hours agoBadlands Daily: September 15, 2025
4,739 watching -
 LIVE
LIVE
The Big Mig™
2 hours agoUncaged Host w/ Controversial Patriot Ret. MLB Closer John Rocker
5,249 watching -
 LIVE
LIVE
Caleb Hammer
46 minutes agoHe Needs To Divorce Her | Financial Audit
107 watching -
 LIVE
LIVE
Chad Prather
50 minutes agoCharlie Kirk’s Impact Felt WORLDWIDE, Even At Coldplay Concert + Pastors SPEAK UP Across America!
522 watching -
 LIVE
LIVE
Wendy Bell Radio
6 hours agoWe Are Charlie.
8,330 watching -
 2:01:01
Matt Kohrs
11 hours agoTesla Stock Is SQUEEZING (Market Open Analysis) || Live Trading
24.4K5 -
 40:43
40:43
Randi Hipper
1 hour agoBIG WEEK FOR BITCOIN! LATEST PRICE UPDATE
14.6K