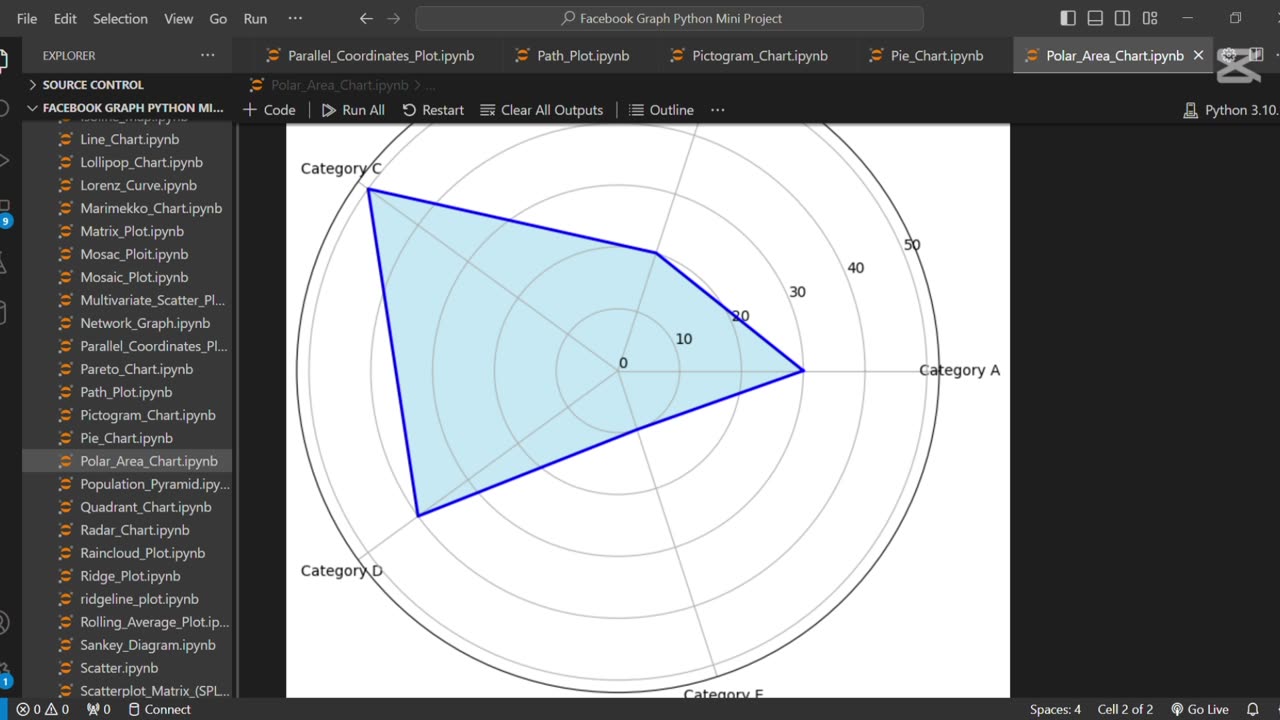
🔵 Create Polar Area Chart Using Python
3 months ago
The line "🔵 Create Polar Area Chart Using Python" refers to generating a circular chart where data is displayed in segments around a polar axis, with each segment's radius representing a value. Python libraries like Matplotlib are used to create these charts for visualizing cyclical data such as seasons, time, or directions.
Loading comments...
-
 1:15
1:15
AI Evolutionary Technology
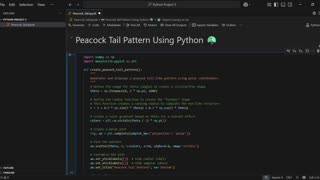
7 days agoCreating a Stunning Peacock Tail Pattern with Python & Matplotlib
41 -
 LIVE
LIVE
IsaiahLCarter
5 hours agoCharlie Kirk, American Martyr (with Mikale Olson) || APOSTATE RADIO 028
49 watching -
 1:35:39
SB Mowing
2 days agoIt took the WHOLE NEIGHBORHOOD to uncover this yards SHOCKING SECRET
58.8K56 -
 12:52
12:52
ROSE UNPLUGGED
21 hours agoFrom Vision to Legacy: Charlie Kirk
36.8K19 -
 1:14:22
Jeff Ahern
5 hours ago $9.85 earnedThe Sunday Show with Jeff Ahern
54.3K28 -
 16:37
16:37
Professor Nez
6 hours ago🚨Internet MELTS DOWN over JD Vance & Trump BREAKING the Democrats!
53.7K169 -
 18:40
18:40
itsSeanDaniel
8 hours agoPiers Morgan CALLED OUT and HUMILIATED by Andrew Tate
62.3K277 -
 LIVE
LIVE
Times Now World
2 days agoLIVE: "ON CAM: How the Charlie Kirk Shooter ESCAPED – Shocking New Footage Revealed!"
284 watching -
 1:45:51
Game On!
1 day ago $11.49 earnedWise Guys Reveal NFL Week 2 BEST BETS Now
95.7K8 -
 26:57
26:57
Robbi On The Record
2 days agoMouth Breathing Is Why You’re Exhausted | with Dr. Melanie Silvestrini
69.1K7