🖼️ Create Pictogram Chart Using Python
6 months ago
5
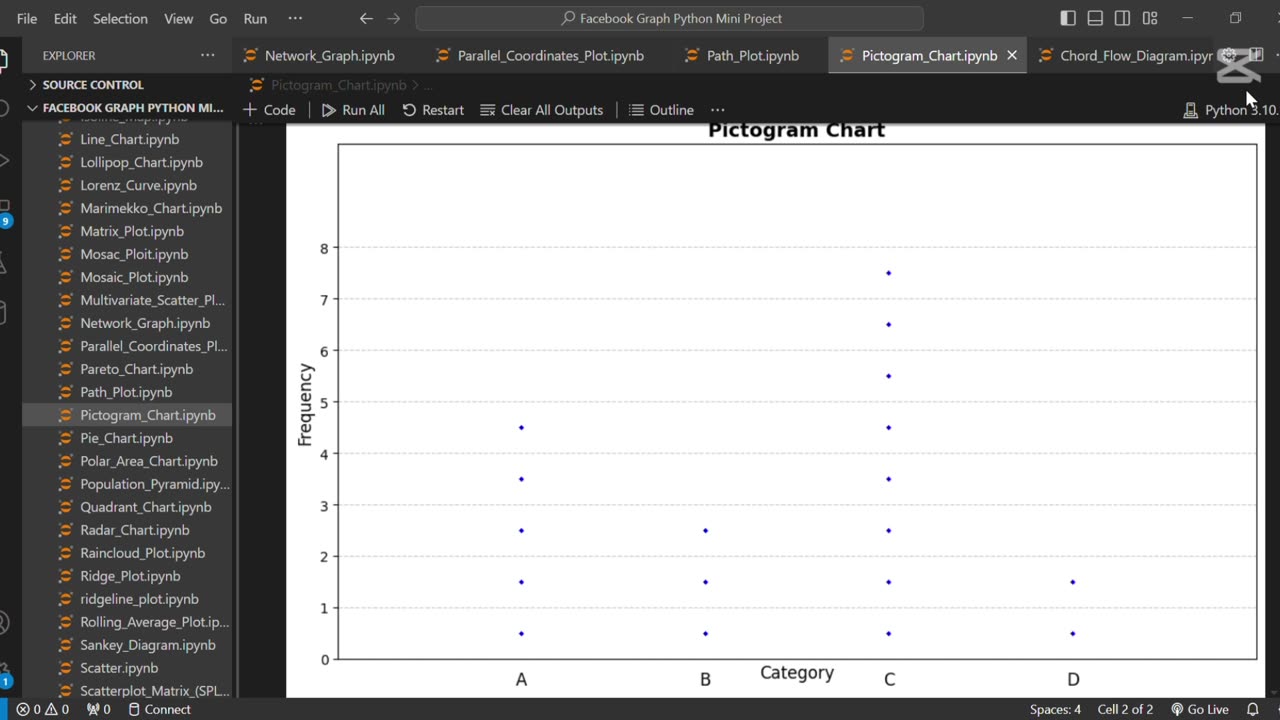
The line **"🖼️ Create Pictogram Chart Using Python"** refers to creating a visual representation of data using icons or images to depict quantities. Python libraries like Plotly or Matplotlib, combined with image processing tools, can be used to build these charts for engaging and easy-to-understand presentations of statistical data.
Loading comments...
-
 0:18
0:18
AI Evolutionary Technology
2 months ago💰 Simple Currency Converter App in Python
41 -
 11:47
11:47
Liberty Hangout
1 day agoAnti-Trump Beta FARTS On Me Instead of Debating
38.9K58 -
 1:37:20
FreshandFit
4 hours agoShe’s Not Your Girl It’s Just Your Turn
28.8K3 -
 5:26:18
Akademiks
6 hours agoEbro has MELTDOWN after Drake tells him to *** SLOWLY! Radio Over? NLE vs Youngboy part 805?
17.6K -
 1:35:27
Inverted World Live
7 hours agoLost Satellites, Wild Horses, and 3i/Atlas
135K4 -
 2:53:42
TimcastIRL
5 hours agoCandace Owens IMPLODES, Audience IN REVOLT, Claim SHES A CLONE Or GOT THE CALL | Timcast IRL
273K200 -
 2:49:53
Barry Cunningham
6 hours agoLIVE BREAKING NEWS: President Trump Celebrates Hanukkah! And More News
53.5K10 -
 1:29:40
Anthony Rogers
13 hours agoEpisode 394 - Isaac Butterfield
25K1 -
 8:02
8:02
China Uncensored
11 hours agoChina Just Took The First Step Towards WAR
31.6K16 -
 1:20:04
Flyover Conservatives
1 day agoWhy Did Jesus Really Come? It’s NOT What You Think - Pedro Adao | FOC Show
30.9K2