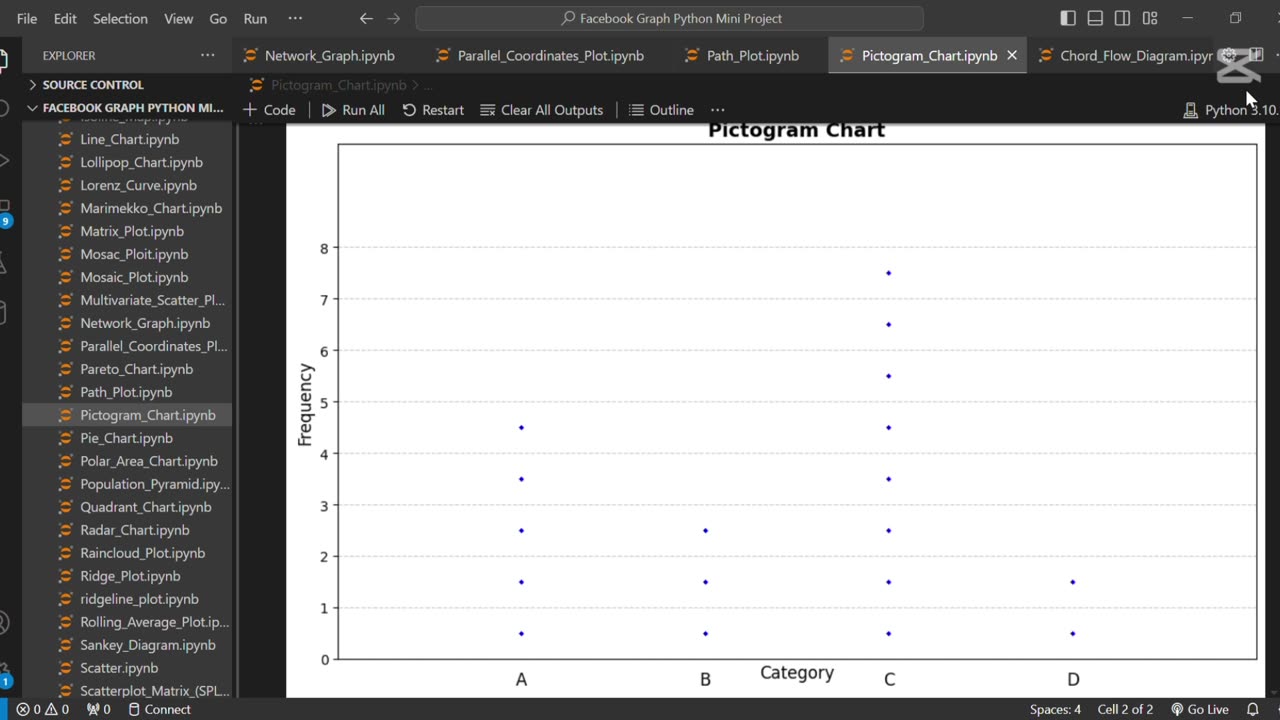
🖼️ Create Pictogram Chart Using Python
6 months ago
5
The line **"🖼️ Create Pictogram Chart Using Python"** refers to creating a visual representation of data using icons or images to depict quantities. Python libraries like Plotly or Matplotlib, combined with image processing tools, can be used to build these charts for engaging and easy-to-understand presentations of statistical data.
Loading comments...
-
 0:09
0:09
AI Evolutionary Technology
7 days agoCreate Customs Custom Heart ASCII Art Using Python
31 -
 LIVE
LIVE
vivafrei
40 minutes agoBrown Shooter Identified - Suspect or Patsy? Judge CONVICTED for Aiding Illegals! Bongino Resigns!
878 watching -
 LIVE
LIVE
The Quartering
3 hours agoTucker Vs Ben Shapiro At AMFEST, Epstein Files Release Today & Brown University Shooter Caught!
2,470 watching -
 34:43
34:43
DeVory Darkins
3 hours agoBREAKING: Jury hands Democrat Judge a GUILTY Verdict after she helped illegal aliens escape
15.9K44 -
 37:49
37:49
theyoungrightusa
14 hours ago $3.37 earnedThe Young Right X AmFest
13.4K2 -
 2:02:50
The Culture War with Tim Pool
4 hours agoThe FALL of Candace Owens | The Culture War with Tim Pool
218K316 -
 1:14:53
Sean Unpaved
2 hours agoThe College Football Playoff Begins Today With Alabama vs. Oklahoma | UNPAVED
13.3K -
 1:36:33
Misfits Mania
2 days ago $14.03 earnedMISFITS MANIA: Weigh-In & Award Ceremony
51.6K9 -
 LIVE
LIVE
Dr Disrespect
4 hours ago🔴LIVE - DR DISRESPECT - ARC RAIDERS - THE FINISH LINE
1,058 watching -
 47:31
47:31
Watchmen Action: Ezekiel 33:6 - Equip The Church To Engage The Culture
5 hours ago $1.35 earnedThe Watchmen Brief LIVE From AmFest2025!
22.2K1