🖼️ Create Pictogram Chart Using Python
3 months ago
1
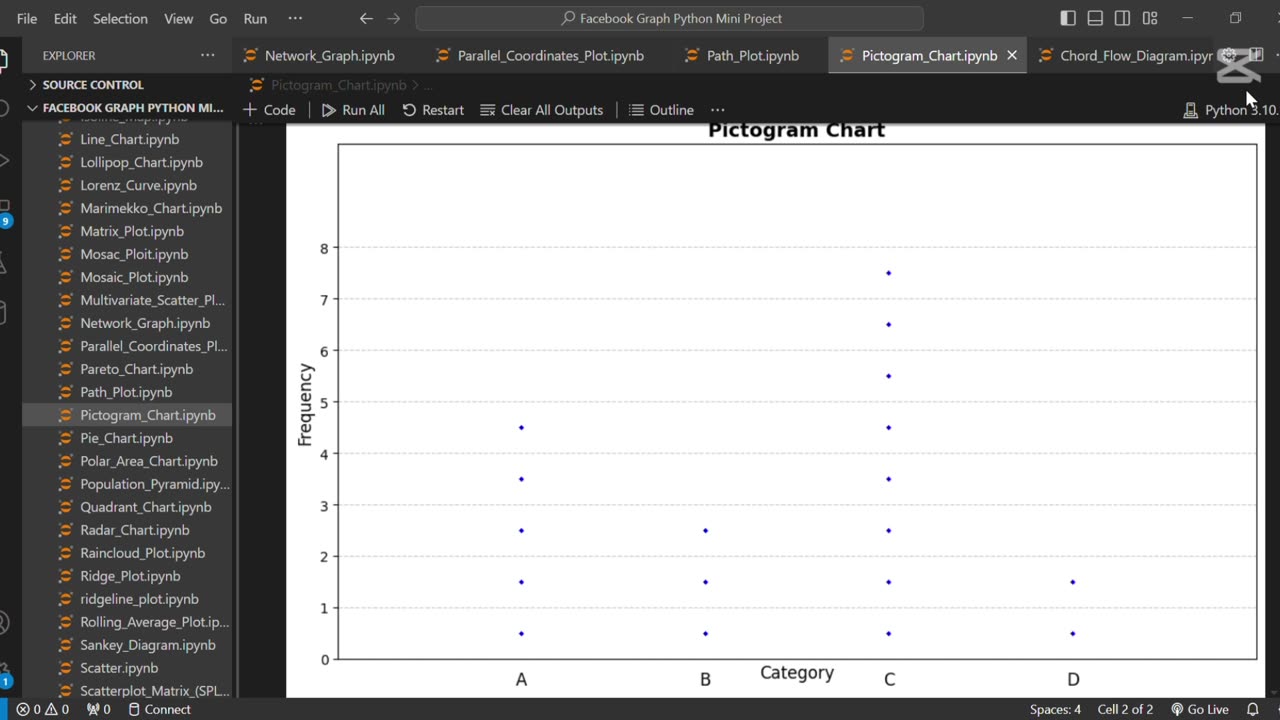
The line **"🖼️ Create Pictogram Chart Using Python"** refers to creating a visual representation of data using icons or images to depict quantities. Python libraries like Plotly or Matplotlib, combined with image processing tools, can be used to build these charts for engaging and easy-to-understand presentations of statistical data.
Loading comments...
-
 1:02
1:02
AI Evolutionary Technology
2 days agoLive Weather App in Python | BeautifulSoup & Web Scraping Tutorial
21 -
 DVR
DVR
Nerdrotic
3 hours ago $1.69 earnedThe Turning Point | New UFO Video with Michael Collins | Forbidden Frontier #117
9.46K1 -
 LIVE
LIVE
vivafrei
10 hours agoEp. 281: Charlie Kirk; Routh Trial; Charlotte Train; Bolsanaro Defense; SCOTUS & MORE!
9,770 watching -
 LIVE
LIVE
Turning Point USA
2 hours agoWASHINGTON D.C. PRAYER VIGIL FOR CHARLIE KIRK
1,937 watching -
 LIVE
LIVE
The Mel K Show
2 hours agoMel K & Tim James | Healing is an Inside Job | 9-14-25
302 watching -
 LIVE
LIVE
IsaiahLCarter
5 hours agoCharlie Kirk, American Martyr (with Mikale Olson) || APOSTATE RADIO 028
50 watching -
 1:35:39
SB Mowing
2 days agoIt took the WHOLE NEIGHBORHOOD to uncover this yards SHOCKING SECRET
58.8K56 -
 12:52
12:52
ROSE UNPLUGGED
21 hours agoFrom Vision to Legacy: Charlie Kirk
36.8K19 -
 1:14:22
Jeff Ahern
5 hours ago $9.85 earnedThe Sunday Show with Jeff Ahern
54.3K28 -
 16:37
16:37
Professor Nez
6 hours ago🚨Internet MELTS DOWN over JD Vance & Trump BREAKING the Democrats!
53.7K165