🛤️ Create Path Plot Using Python
3 months ago
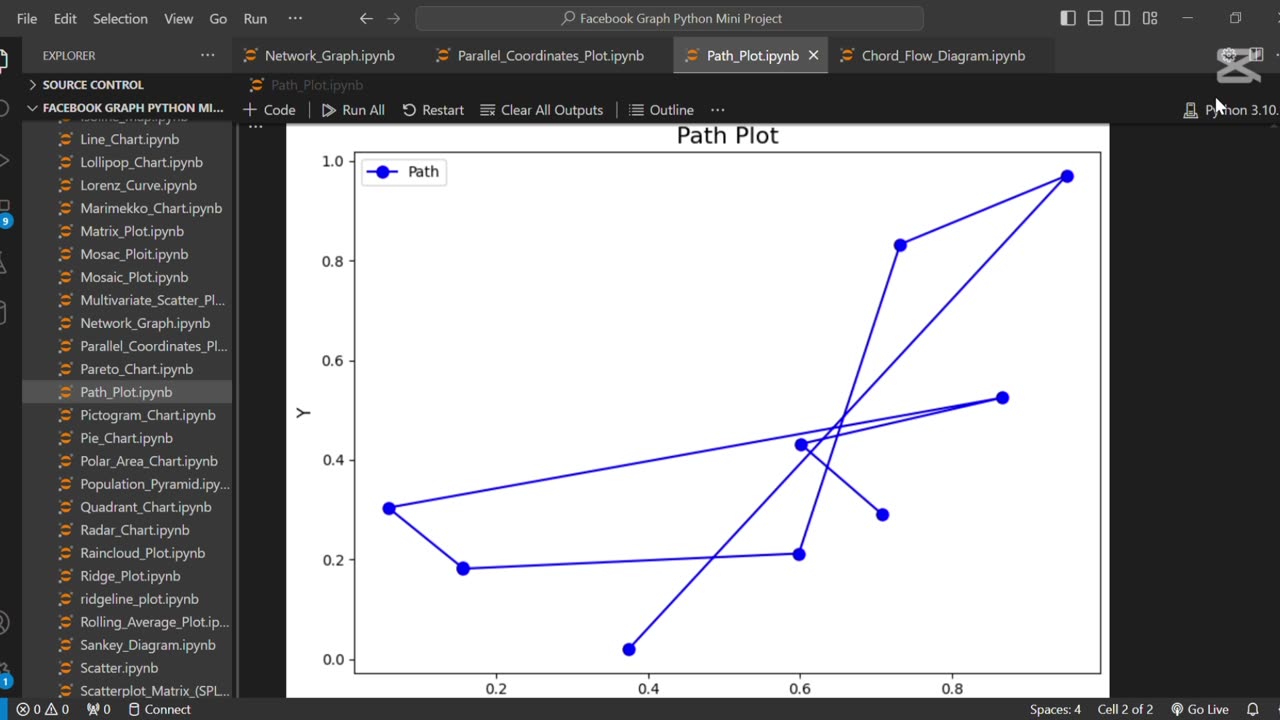
The line **"🛤️ Create Path Plot Using Python"** refers to visualizing a sequence of points or movements, often used to represent trajectories or routes over time. Python libraries like Matplotlib or Plotly are commonly used to create path plots for analyzing movement patterns, such as GPS tracks or simulation paths.
Loading comments...
-
 0:17
0:17
AI Evolutionary Technology
8 days agoVisualizing Molecular Structure From SMILES Using RDKit 🧪
1 -
 LIVE
LIVE
The Charlie Kirk Show
2 hours agoTPUSA Presents This is The Turning Point Tour LIVE with Michael Knowles
5,400 watching -
 LIVE
LIVE
Drew Hernandez
6 hours agoDISNEY CUCKS FOR KIMMEL & ADDRESSING THE CHARLIE KIRK MEMORIAL AFTERMATH
724 watching -
 LIVE
LIVE
Flyover Conservatives
5 hours agoThe Most Overlooked Way to Fight Abortion (It’s Not Protests) - Robert Netzly; Why Triple-Digit Silver is Coming - Dr. Kirk Elliott | FOC Show
190 watching -
 1:55:33
Glenn Greenwald
5 hours agoDeceitful Hysteria over Tucker's Speech on Kirk; IDF Funder Larry Ellison to Take Over CBS, Paramount, and now TikTok; U.S. Embraces Leading Al-Qaeda Terrorist | SYSTEM UPDATE #519
133K39 -
 34:40
34:40
Donald Trump Jr.
6 hours agoWe Will Make Charlie Proud | TRIGGERED Ep.276
161K81 -
 1:01:49
BonginoReport
5 hours agoErika Kirk Forgives Charlie’s Assassin - Nightly Scroll w/ Hayley Caronia (Ep.139)
61.2K61 -
 LIVE
LIVE
megimu32
2 hours agoOn The Subject: Rush Hour | Would It Be Cancelled Today?
121 watching -
 1:24:12
Katie Miller Pod
4 hours ago $1.83 earnedEpisode 7 - Jillian Michaels | The Katie Miller Podcast
53.5K3 -
 LIVE
LIVE
LFA TV
1 day agoLFA TV ALL DAY STREAM ! | MONDAY 9/22/25
707 watching