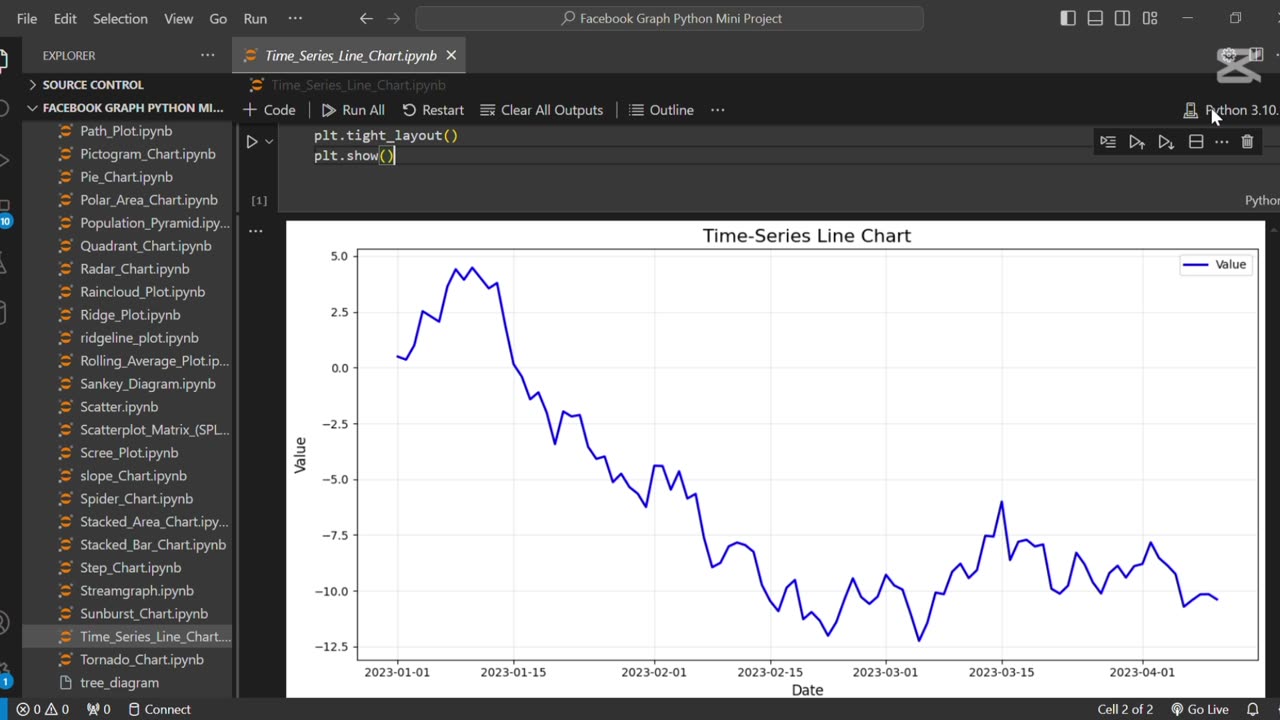
⏳ Create The Time Series Line Chart Using Python
Loading comments...
-
 0:17
0:17
AI Evolutionary Technology
3 months agoVisualizing Molecular Structure From SMILES Using RDKit 🧪
6 -
 17:33
17:33
Cash Jordan
2 hours ago25,000 Homeless SEIZE NYC’s Subway… as “Communist Mayor” HANDS CITY to SQUATTERS
1173 -
 1:01:04
The Rubin Report
2 hours agoMSNOW Host Realizes Ilhan Omar Is a Monster After Her Australia Shooting Reaction
19.1K38 -

The Bubba Army
3 days ago"ROB REINER MURDERED" By His Own Son? - Bubba the Love Sponge® Show | 12/15/25
8.82K -
 17:09
17:09
Professor Nez
1 hour agoObama’s Operative Just Got HUMILIATED After Trying to IMPEACH America!
9.8K17 -
 LIVE
LIVE
LFA TV
19 hours agoLIVE & BREAKING NEWS! | MONDAY 12/15/25
3,966 watching -
 59:10
59:10
VINCE
4 hours agoViolence Across The World: Brown University, Australia, Syria | Episode 188 - 12/15/25 VINCE
204K110 -
 LIVE
LIVE
The Shannon Joy Show
2 hours ago🔥SJ LIVE Dec 15 - A Violent Weekend, A Peoples Coup In Bulgaria & A Trump EO For Big Tech Granting Immunity & Supremacy🔥
196 watching -
 50:00
50:00
Grant Stinchfield
1 hour agoThe Cost of Wokeness... Disarmament Is the Danger
2.52K2 -
 2:28:14
Nikko Ortiz
2 hours agoReaction Time With Special Guest... | Rumble LIVE
26.1K