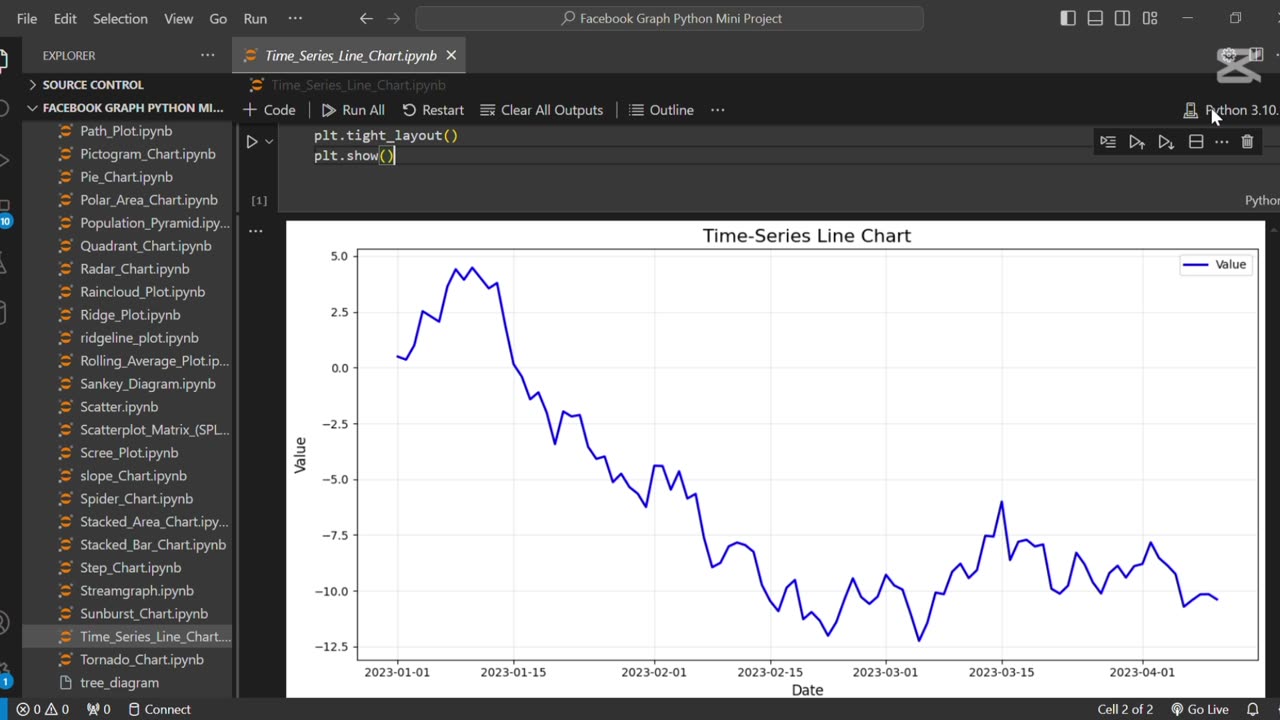
⏳ Create The Time Series Line Chart Using Python
Loading comments...
-
 0:17
0:17
AI Evolutionary Technology
3 months agoVisualizing Molecular Structure From SMILES Using RDKit 🧪
6 -
 2:53:42
TimcastIRL
5 hours agoCandace Owens IMPLODES, Audience IN REVOLT, Claim SHES A CLONE Or GOT THE CALL | Timcast IRL
262K200 -
 2:49:53
Barry Cunningham
6 hours agoLIVE BREAKING NEWS: President Trump Celebrates Hanukkah! And More News
53.5K10 -
 1:29:40
Anthony Rogers
13 hours agoEpisode 394 - Isaac Butterfield
18.9K1 -
 8:02
8:02
China Uncensored
11 hours agoChina Just Took The First Step Towards WAR
23.6K16 -
 1:20:04
Flyover Conservatives
1 day agoWhy Did Jesus Really Come? It’s NOT What You Think - Pedro Adao | FOC Show
30.9K2 -

DLDAfterDark
3 hours ago $2.55 earnedYo Homie! Is That My Briefcase?? EDC & Gun Talk - Blue Waffle Giveaway Pre Stream
29.1K2 -
 1:34:23
Glenn Greenwald
8 hours agoSydney Shooting Exploited for Pro-Israel Censorship and Anti-Muslim Crackdowns; How Media DEI Was the Opposite of Diversity | SYSTEM UPDATE #559
140K126 -
 1:09:01
MattMorseTV
7 hours ago $53.39 earned🔴Trump just handed Congress THE EVIDENCE.🔴
56.8K115 -
 1:01:54
BonginoReport
8 hours agoVanity Fair Goes Nuclear On Trump’s Inner Circle - Nightly Scroll w/ Hayley Caronia (Ep.198)
153K64