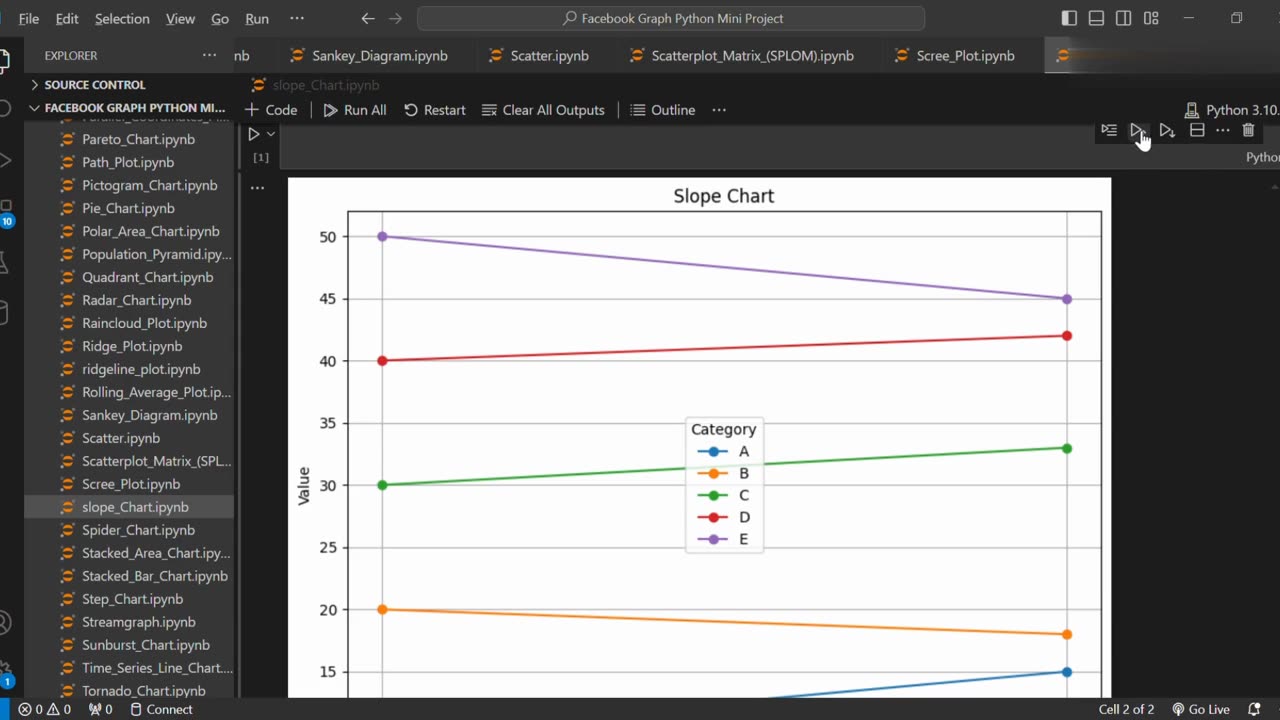
↗️ Create Slope Chart Using Python
Loading 1 comment...
-
 0:18
0:18
AI Evolutionary Technology
1 month ago💰 Simple Currency Converter App in Python
20 -
 LIVE
LIVE
MattMorseTV
5 hours ago $23.13 earned🔴Trump's '60 Minutes' INTERVIEW + MUCH MORE.🔴
7,611 watching -

Badlands Media
10 hours agoBaseless Conspiracies Ep. 157
17K11 -
 2:06:09
Inverted World Live
6 hours agoMysterious Crash at Area 51 | Ep. 134
5.87K2 -
 2:48:59
TimcastIRL
4 hours agoTrump Endorses Cuomo, Says NO COMMIE MAMDANI, Obama REFUSES To Endorse Mamdani | Timcast IRL
244K124 -
 LIVE
LIVE
Drew Hernandez
22 hours agoGOP CIVIL WAR: TUCKER CARLSON DERANGEMENT SYNDROME AT ALL TIME HIGH
1,154 watching -
 14:44
14:44
Sponsored By Jesus Podcast
1 day agoYou Can't Serve God & MONEY | Is Money the Root of All Evil?
5.44K14 -
 2:47:28
Barry Cunningham
8 hours agoYOU'VE BEEN MISINFORMED! GREED IS ACTUALLY GOOD! ESPECIALLY NOW! (AND MORE NEWS)
80.8K31 -
 LIVE
LIVE
SpartakusLIVE
8 hours agoSNIPING in Battlefield 6 - REDSEC || Monday MOTIVATION to CONQUER the Week
169 watching -
 49:25
49:25
ThisIsDeLaCruz
4 hours ago $4.69 earnedBack Stage Pass with Avenged Sevenfold
31.3K7