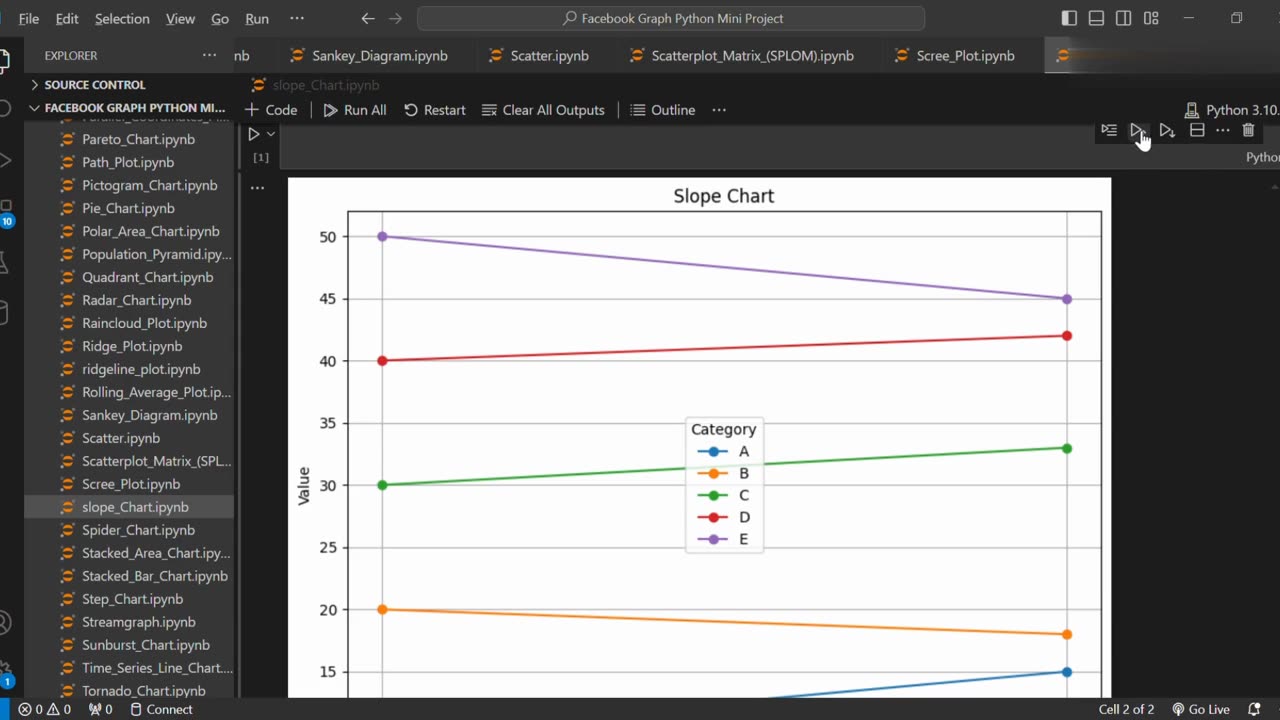
↗️ Create Slope Chart Using Python
Loading 1 comment...
-
 0:45
0:45
AI Evolutionary Technology
8 days ago🌙 Eid Milad-un-Nabi ﷺ 2025 | Beautiful Python Animation Tribute
4 -
 1:35:39
SB Mowing
2 days agoIt took the WHOLE NEIGHBORHOOD to uncover this yards SHOCKING SECRET
17.7K33 -
 12:52
12:52
ROSE UNPLUGGED
18 hours agoFrom Vision to Legacy: Charlie Kirk
14.9K8 -
 1:14:22
Jeff Ahern
2 hours ago $2.75 earnedThe Sunday Show with Jeff Ahern
13.2K3 -
 16:37
16:37
Professor Nez
3 hours ago🚨Internet MELTS DOWN over JD Vance & Trump BREAKING the Democrats!
25.5K110 -
 LIVE
LIVE
Major League Fishing
4 days agoLIVE! - Fishing Clash Team Series: Heritage Cup - Day 1
1,544 watching -
 18:40
18:40
itsSeanDaniel
5 hours agoPiers Morgan CALLED OUT and HUMILIATED by Andrew Tate
31.6K228 -
 LIVE
LIVE
Times Now World
2 days agoLIVE: "ON CAM: How the Charlie Kirk Shooter ESCAPED – Shocking New Footage Revealed!"
359 watching -
 1:45:51
Game On!
1 day ago $10.94 earnedWise Guys Reveal NFL Week 2 BEST BETS Now
71.9K8 -
 26:57
26:57
Robbi On The Record
2 days agoMouth Breathing Is Why You’re Exhausted | with Dr. Melanie Silvestrini
38.7K5