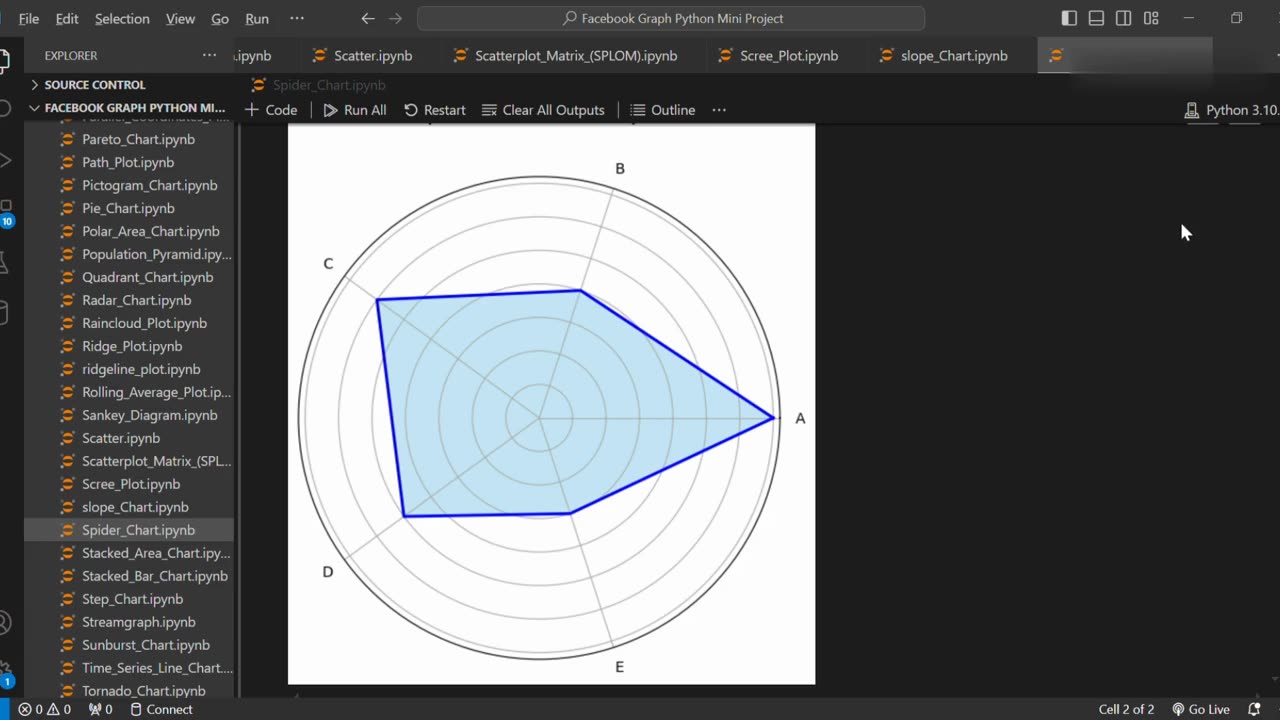
Create Spider Chart Using Python
6 months ago
7
A Spider Chart (also known as a Radar Chart) is a graphical method used to display multivariate data in a way that highlights differences between multiple variables. Using Python libraries like matplotlib, you can easily create customizable spider charts to visualize performance metrics, skill comparisons, or survey data.
Loading 2 comments...
-
 1:17
1:17
AI Evolutionary Technology
1 day agoBuild a Barcode Generator in Python | Step-by-Step Tutorial for Beginners
1 -
 1:14:53
Sean Unpaved
2 hours agoThe College Football Playoff Begins Today With Alabama vs. Oklahoma | UNPAVED
13.3K -
 1:36:33
Misfits Mania
2 days ago $14.03 earnedMISFITS MANIA: Weigh-In & Award Ceremony
51.6K9 -
 LIVE
LIVE
Dr Disrespect
4 hours ago🔴LIVE - DR DISRESPECT - ARC RAIDERS - THE FINISH LINE
1,058 watching -
 47:31
47:31
Watchmen Action: Ezekiel 33:6 - Equip The Church To Engage The Culture
5 hours ago $1.35 earnedThe Watchmen Brief LIVE From AmFest2025!
22.2K1 -
 1:00:45
Graham Allen
4 hours agoLive From AMFEST 2025: Day 2
48.2K38 -
 LIVE
LIVE
LFA TV
11 hours agoLIVE & BREAKING NEWS! | FRIDAY 12/19/25
1,271 watching -
 1:50:19
The Mel K Show
3 hours agoMORNINGS WITH MEL K-The Lawfare Squad Takes a Victory Lap-Indefensible Idiocy is to Blame! 12-19-25
23.1K11 -
 LIVE
LIVE
The Shannon Joy Show
4 hours ago🔥SJ LIVE Dec 19 - Friday Midday Matinee W/Shannon Joy! Featuring "American Experience: Jonestown"🔥
26 watching -
 1:02:48
Trumpet Daily
3 hours ago $2.73 earnedTrumpet Daily LIVE | Dec. 19, 2025
12.2K4