Create Spider Chart Using Python
3 months ago
4
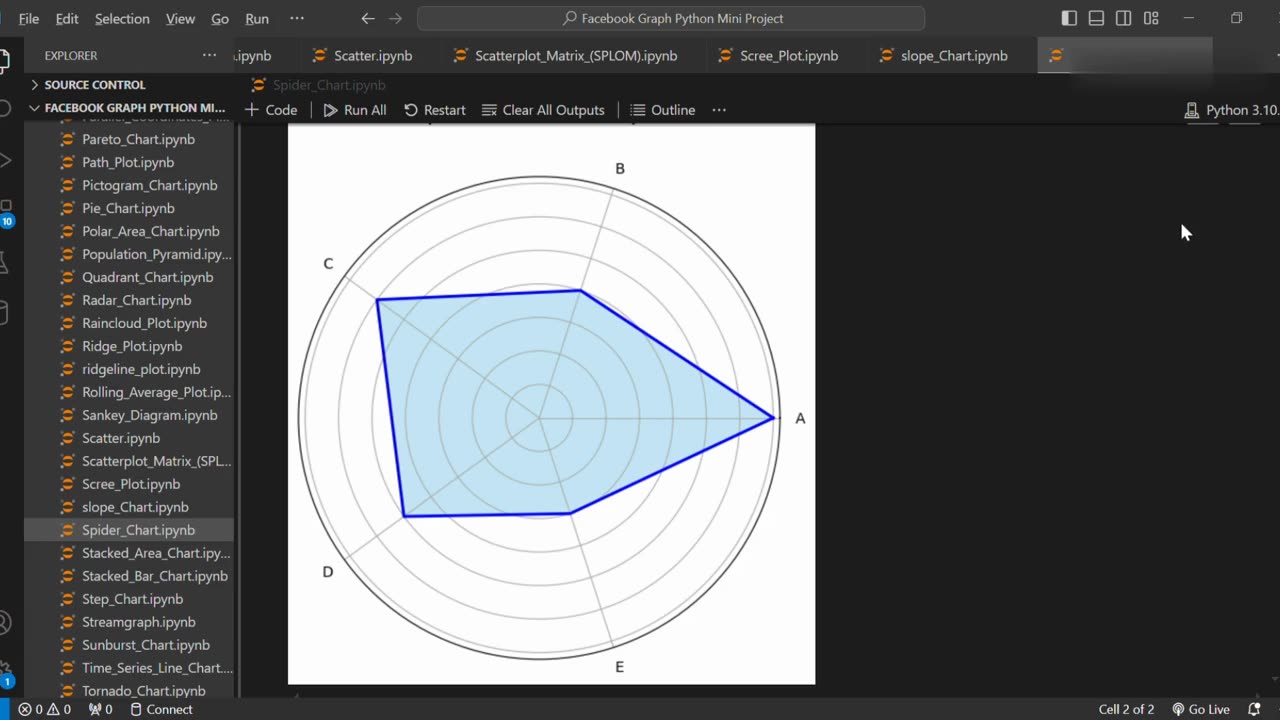
A Spider Chart (also known as a Radar Chart) is a graphical method used to display multivariate data in a way that highlights differences between multiple variables. Using Python libraries like matplotlib, you can easily create customizable spider charts to visualize performance metrics, skill comparisons, or survey data.
Loading 2 comments...
-
 1:06
1:06
AI Evolutionary Technology
3 days agoAdd Stunning Colors to Your Python Console | Text Styling Made Easy
7 -
 DVR
DVR
IsaiahLCarter
8 hours ago $2.06 earnedCharlie Kirk, American Martyr (with Mikale Olson) || APOSTATE RADIO 028
32K -
 16:43
16:43
Mrgunsngear
11 hours ago $2.22 earnedKimber 2K11 Pro Review 🇺🇸
18.2K11 -
 13:40
13:40
Michael Button
1 day ago $0.94 earnedThe Strangest Theory of Human Evolution
17.4K16 -
 10:19
10:19
Blackstone Griddles
1 day agoMahi-Mahi Fish Tacos on the Blackstone Griddle
12.4K2 -
 23:51
23:51
Jasmin Laine
1 day ago“Stop Wasting My Time!”—Trump's BRUTAL WARNING To Canada As Poilievre ROASTS CBC LIVE
10.1K25 -
 9:54
9:54
Millionaire Mentor
1 day agoNBC Host EXPOSES JB Pritzker For Saying This About Trump
5.86K8 -
 1:35:39
SB Mowing
2 days agoIt took the WHOLE NEIGHBORHOOD to uncover this yards SHOCKING SECRET
91.2K61 -
 12:52
12:52
ROSE UNPLUGGED
1 day agoFrom Vision to Legacy: Charlie Kirk
57.2K21 -
 1:14:22
Jeff Ahern
8 hours ago $11.82 earnedThe Sunday Show with Jeff Ahern
83.2K35